
Exploratory Data Analysis of UEFA Champions League 1955-2023
![]()
Table of Contents
- Project Overview
- Data Sources & tools
- Data Cleaning & Preparation
- Exploratory Data Analysis
- Results and Findings
- Recommendations and Insights
- Limitations
- References
Project Overview
The UEFA Champions League (UCL) is one of the most prestigious football tournaments in the world, organized annually by the Union of European Football Associations (UEFA). It features the top football clubs from Europe’s domestic leagues, competing in a series of knockout rounds culminating in a final to determine the best club team in Europe. Established in 1955 as the European Cup, the competition was rebranded as the Champions League in 1992, expanding its format to include more teams and delivering unforgettable moments of football excellence. The tournament is renowned for its high level of competition, dramatic matches, and iconic victories, making it a pinnacle of club football globally.
In this project I have performed a complete Data Exploration of the UCL history from the 1955-56 season up to the 2022-23 season. Through the analysis of multiple details on matches and team performances, my goal is to uncover patterns, establish benchmarks, and achieve a more profound understanding of the UCL competition.
Data Sources and tools
The datasets used in this project UCL_AllTime_Performance_Table.csv and UCL_Finals_1955-2023.csv were retrieved on Kaggle. Both offer detailed insights into match results and team performances spanning decades of Europe’s top club football competition. In particular UCL_AllTime_Performance_Table.csv contains information about the UCL teams performances (e.g. number of matches, wins, draws and losses), while UCL_Finals_1955-2023.csv includes several metrics about each UCL final as the winners, runners-up, attendance etc. We acknwoledge Fardifa Fathmiul Alam for the detailed data files description listed below.
Finals Details (1955-56 to 2022-23)
Season: The football season during which the final was played.Country: The home country of the winning team.Winners: The name of the winning team.Score: The final score at the end of the match.Runners-up: The team that finished second.Country: The home country of the runners-up.Venue: Location of the final match.Attendance: Number of spectators present at the venue.Notes: Additional information such as whether the match went into extra time or any other notable events.
Team Performances (Aggregate Data)
Team: Name of the team.M.(Matches Played): Total number of matches played by the team in the Champions League.W(Wins): Total wins.D(Draws): Total draws.L(Losses): Total losses.Goals: Goals scored against goals conceded.Dif(Goal Difference): Goal difference.Pt(Points): Points accumulated based on match outcomes.
Data Cleaning and Preparation
For any detailes about data pre-processing check the full code on my GitHub repository!
Exploratory Data Analysis
Exploratory Data Analysis (EDA) process consists of exploring the dataset to answer key questions, such as:
- Which teams have been the most successful in terms of wins, finals appearances, and consistent performance?
- Which countries have produced the most successful teams?
- How do teams’ performances differ when playing at home versus away?
- What are the trends in match attendance over the years, and how do they vary by country?
Results and Findings
Our comprehensive analysis of the UCL from the 1955-56 season to the 2022-23 season reveals several key insights into the competition’s evolution and dynamics.
Team performances
Firstly we examined which teams dominate the competition based on their appearences and wins.
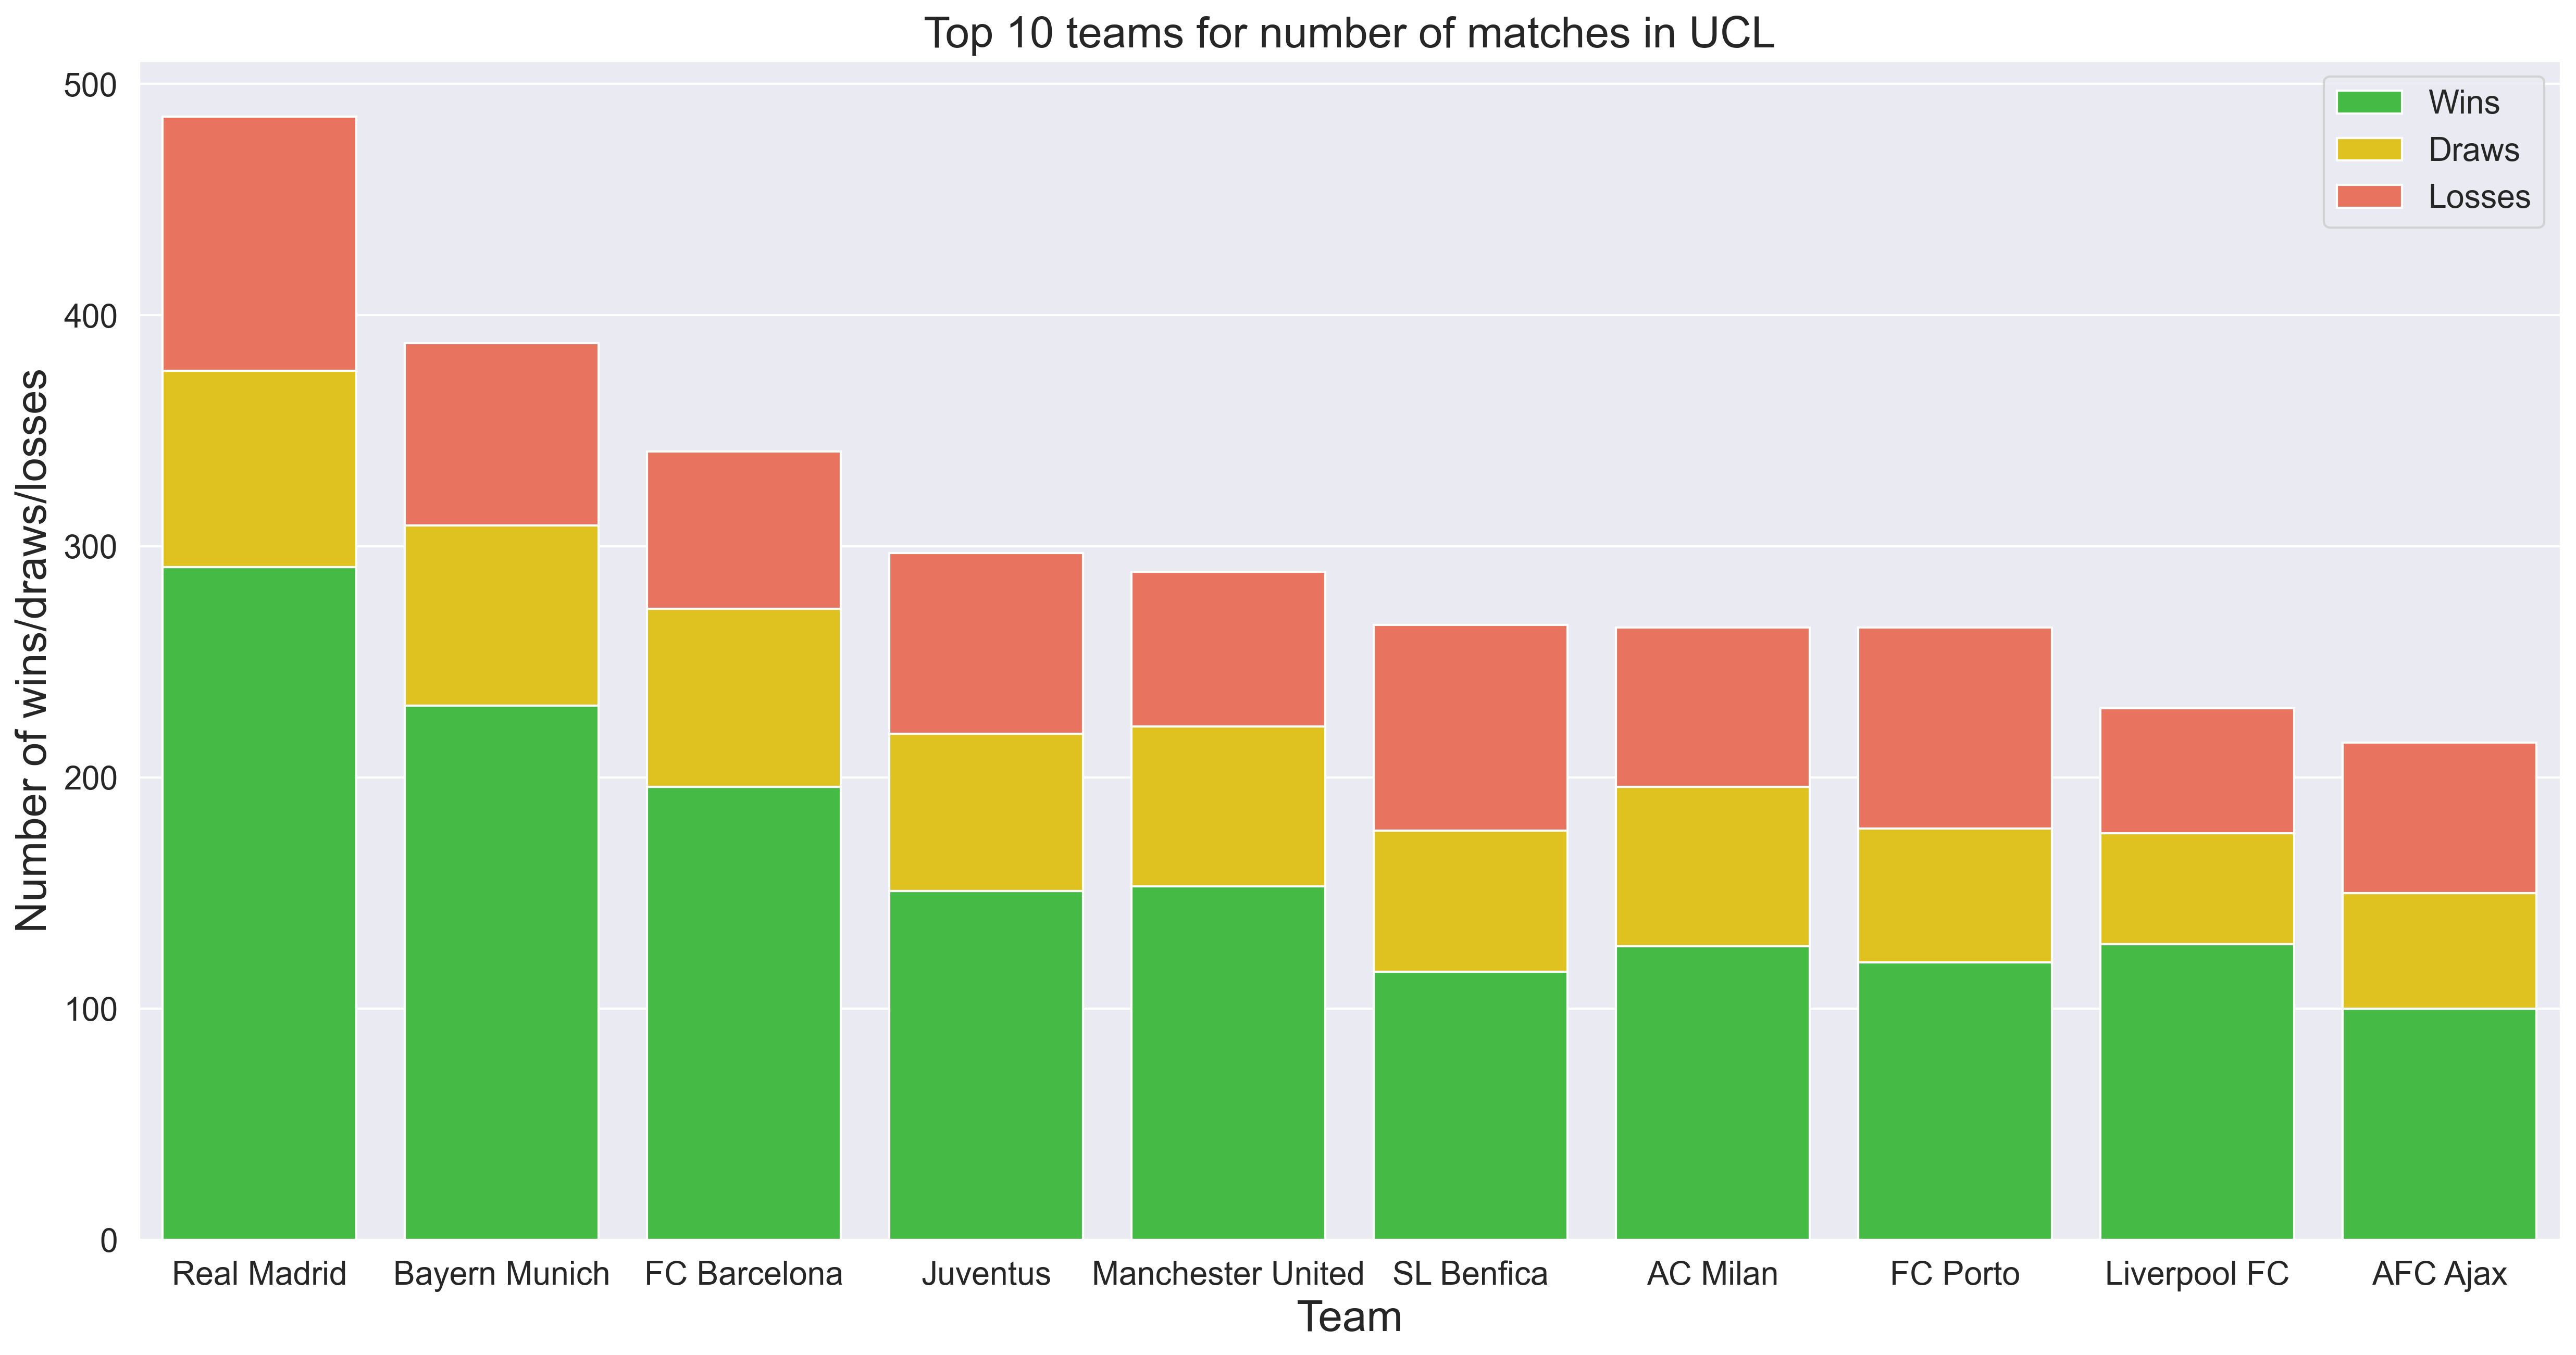
Figure 1: Distribution of the top 10 teams for number of played matches in UCL.
Figure 1 highlights that Real Madrid stands out as the most prominent team in UCL history, with nearly 500 games and close to 300 victories. Bayern Munich ranks second in terms of matches played, followed by FC Barcelona; both have played over 300 but fewer than 400 matches in the UCL. Remarkably, Real Madrid’s win count nearly matches the total number of matches Juventus has played, placing Juventus fourth in this ranking. Despite Real Madrid’s dominance, the data also indicates that it is not the top team in terms of win/loss ratio (W/L), as illustrated in Figure 2.
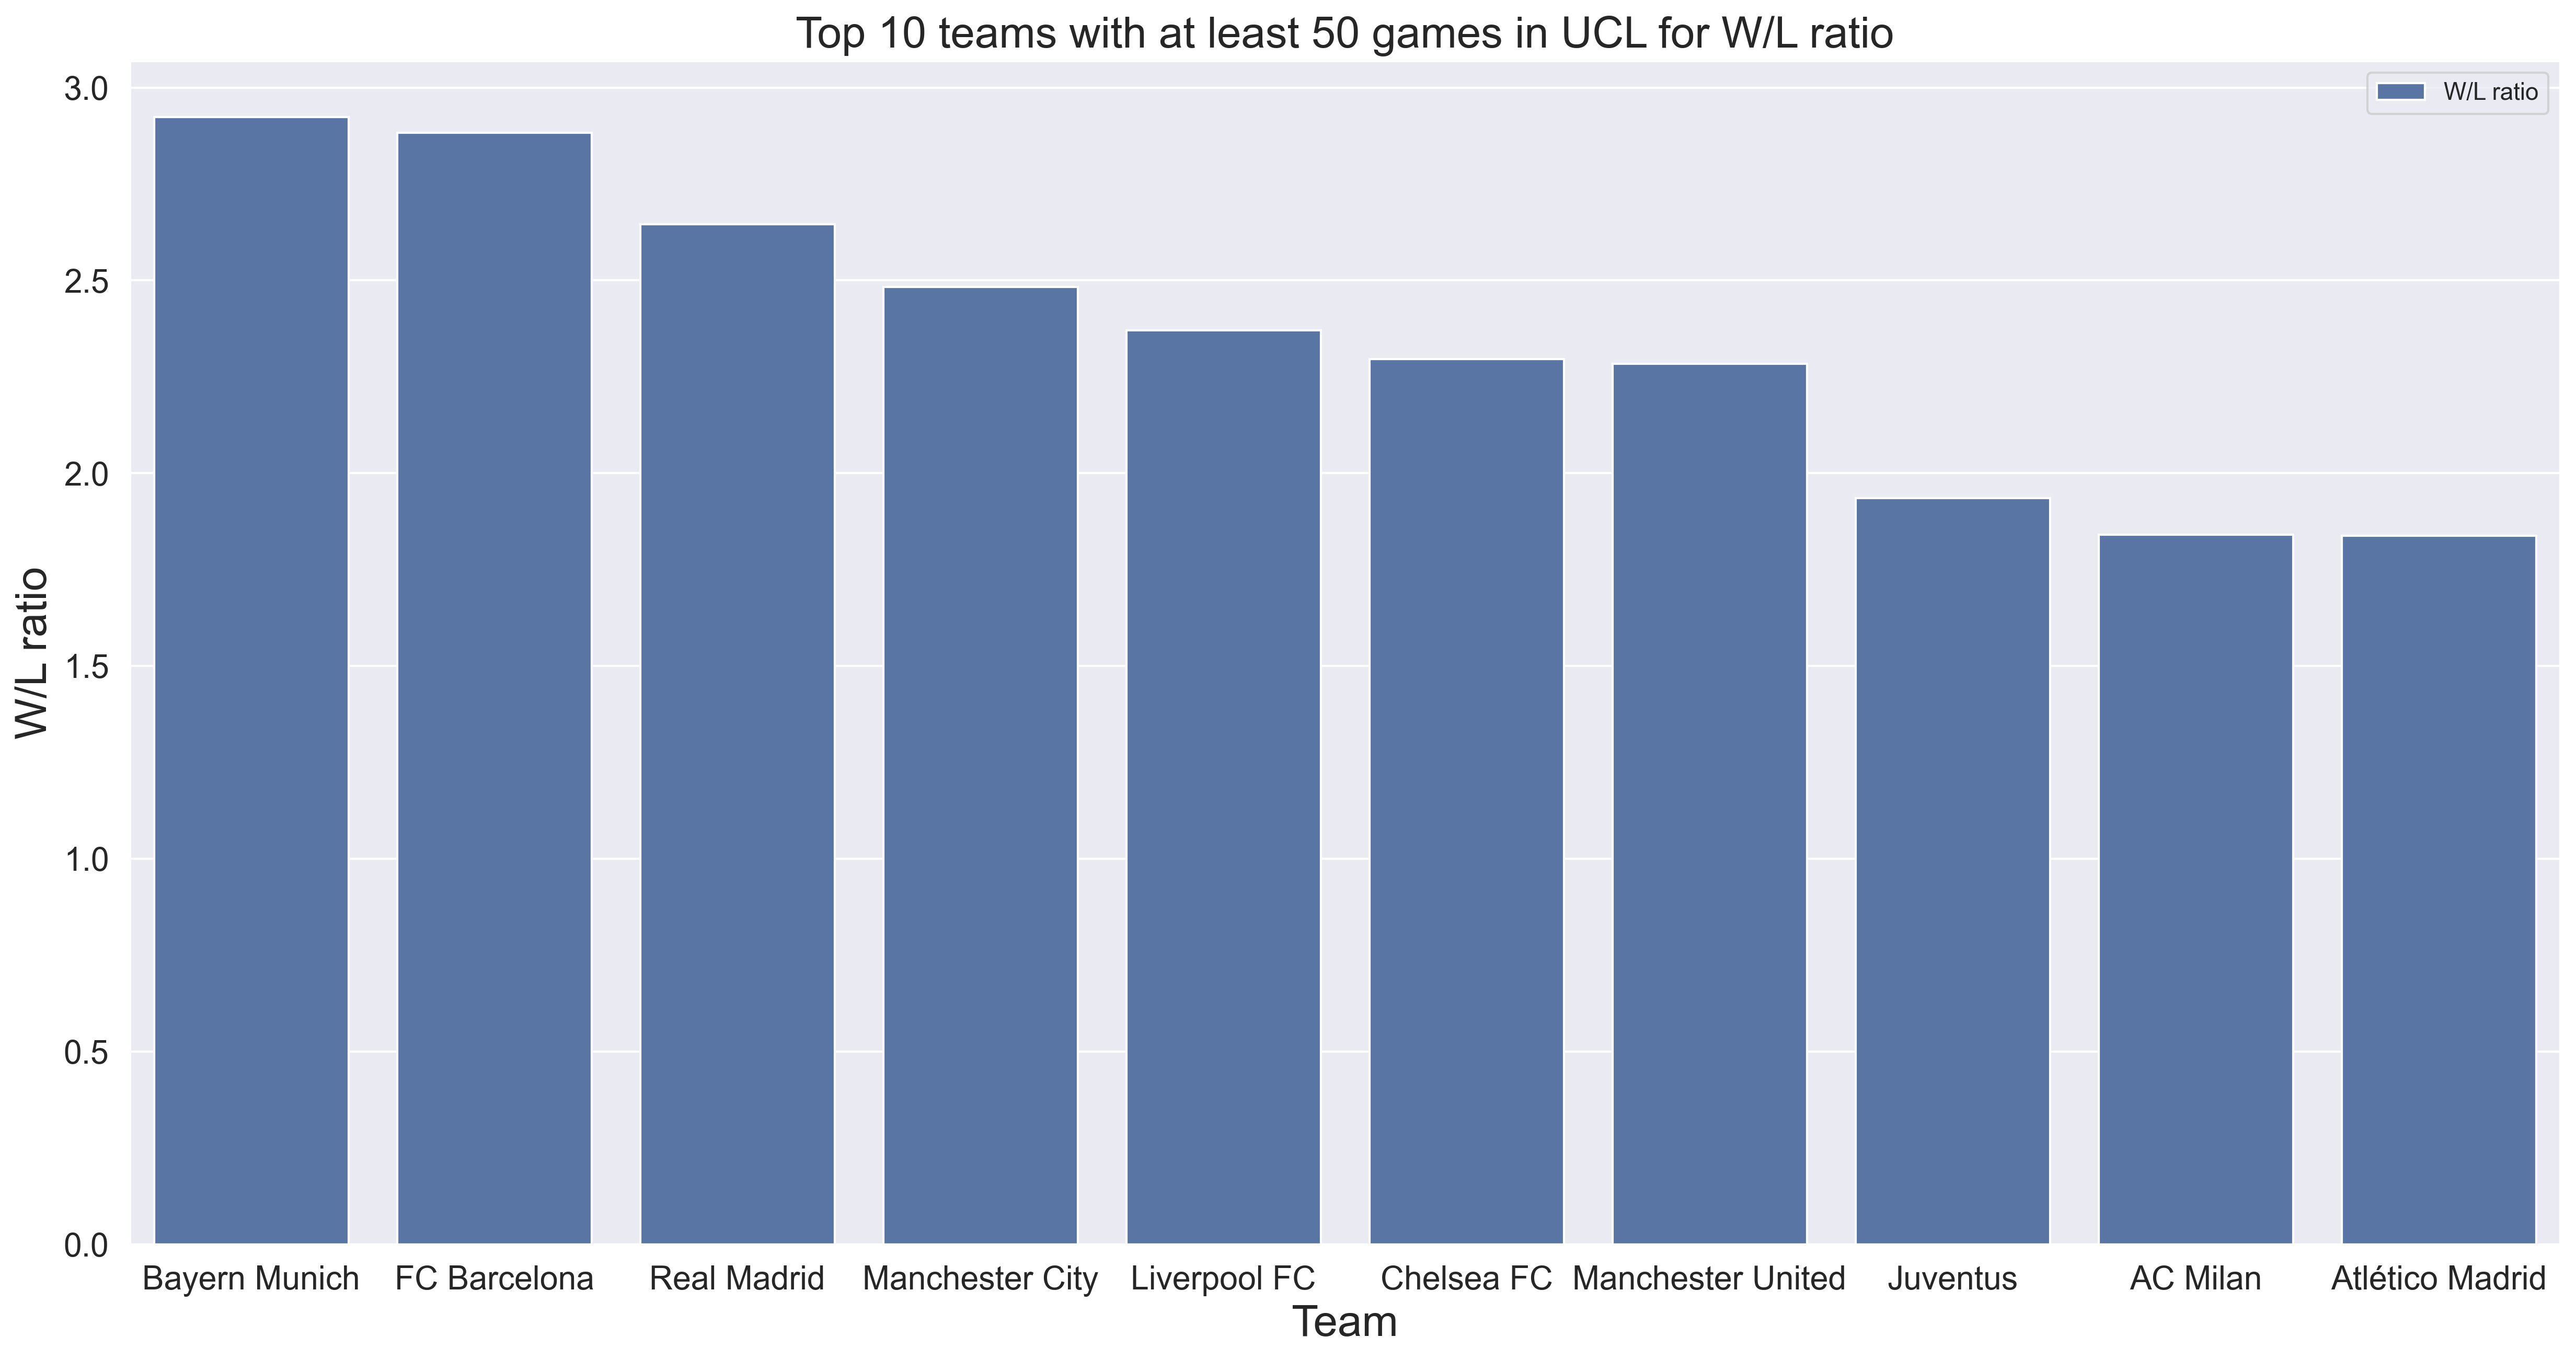
Figure 2: Distribution of the top 10 teams for win/loss ratio in UCL.
Indeed, Bayern Munich and FC Barcelona have slightly higher win/loss ratios compared to Real Madrid. Notably, the plot also highlights the emergence of teams such as Manchester City and Paris Saint-Germain, which are not among the top 10 teams in terms of UCL appearances. This suggests that while these teams lack a long-standing history in the UCL, they have become increasingly influential in the European football landscape in recent years (Man City UCL, PSG UCL). We emphasize that this conclusion could not be drawn solely from our datasets, as they lack information about the number of appearances of each team per year. Instead, it was derived by combining our data with the UEFA database. Additionally, for this analysis, we included only teams with at least 50 UCL matches, thereby avoiding cases like that of Zbrojovka Brno, a team that played in the UCL only once in the early 1960s, achieving 1 win and 4 draws. Since they did not lose any match, their W/L ratio would be misleading.
We then analyzed the top five teams with the most UCL titles, along with the best runners-up in the competition’s history as shown in Figure 3. Real Madrid clearly stands out with 14 titles, double the amount won by AC Milan and Bayern Munich, who are tied for second place. Conversely, Juventus has the highest number of UCL final losses, with 7 defeats, followed by Bayern Munich and SL Benfica, each with 5 losses.
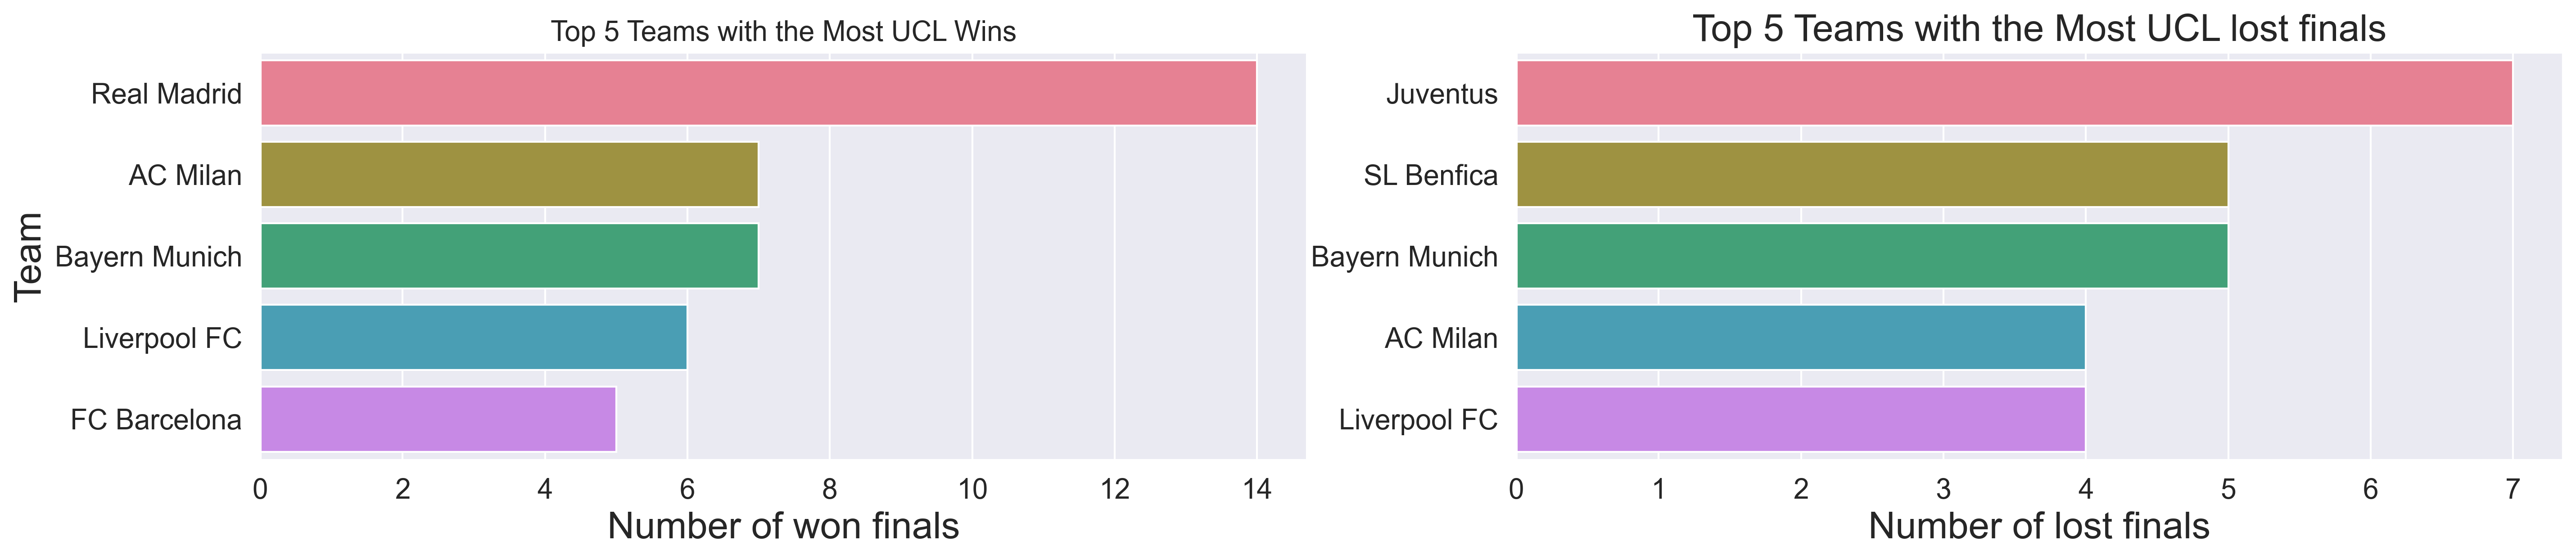
Figure 3: On left panel, distribution of the top five teams per UCL titles. On right panel, distribution of the top five teams per number of lost UCL finals.
We also aimed to explore any potential relationship between the number of matches played and the number of wins. The left panel of Figure 4 illustrates the dataset with the number of matches as the independent variable and the number of wins as the dependent variable. A clear upward trend is evident, indicating that as the number of games increases, so do the number of wins. However, this trend is not merely a reflection of the Law of Large Numbers, which suggests that the number of wins should approximate the probability of winning times the number of matches. According to this principle, with a win probability of 1/3, one would expect Real Madrid to win approximately 500/3, i.e. 167 games, after 500 matches. In reality, Real Madrid has won 291 out of 486 matches, giving a win rate of about 59 %. This discrepancy indicates that as a team plays more games, it gains valuable experience. The plot shows that up to around 100 games, the number of wins is roughly one-third of the matches played. Beyond this point, it appears that teams have accumulated sufficient experience, leading to a winning probability of approximately 50 % in UCL matches. When reaching the most dominant teams of the UCL competition (i.e. Real Madrid, Bayern Munich and FC Barcelona) the winning probability nearly corresponds to 60 %.
To make this qualitative analysis statistical robust we performed two different regression on our dataset: linear fit and quadratic fit, then evaluate the R2 score score and the MSE. As evident from the right panel of the Figure 4, the quadratic fit outperformed the linear with a MSE=19 and R2=0.98 against a MSE=49 and R2=0.95 for the linear case. Thus, this analysis would indicate that the process of learning and gaining expertise is not linear but more likely quadratic.
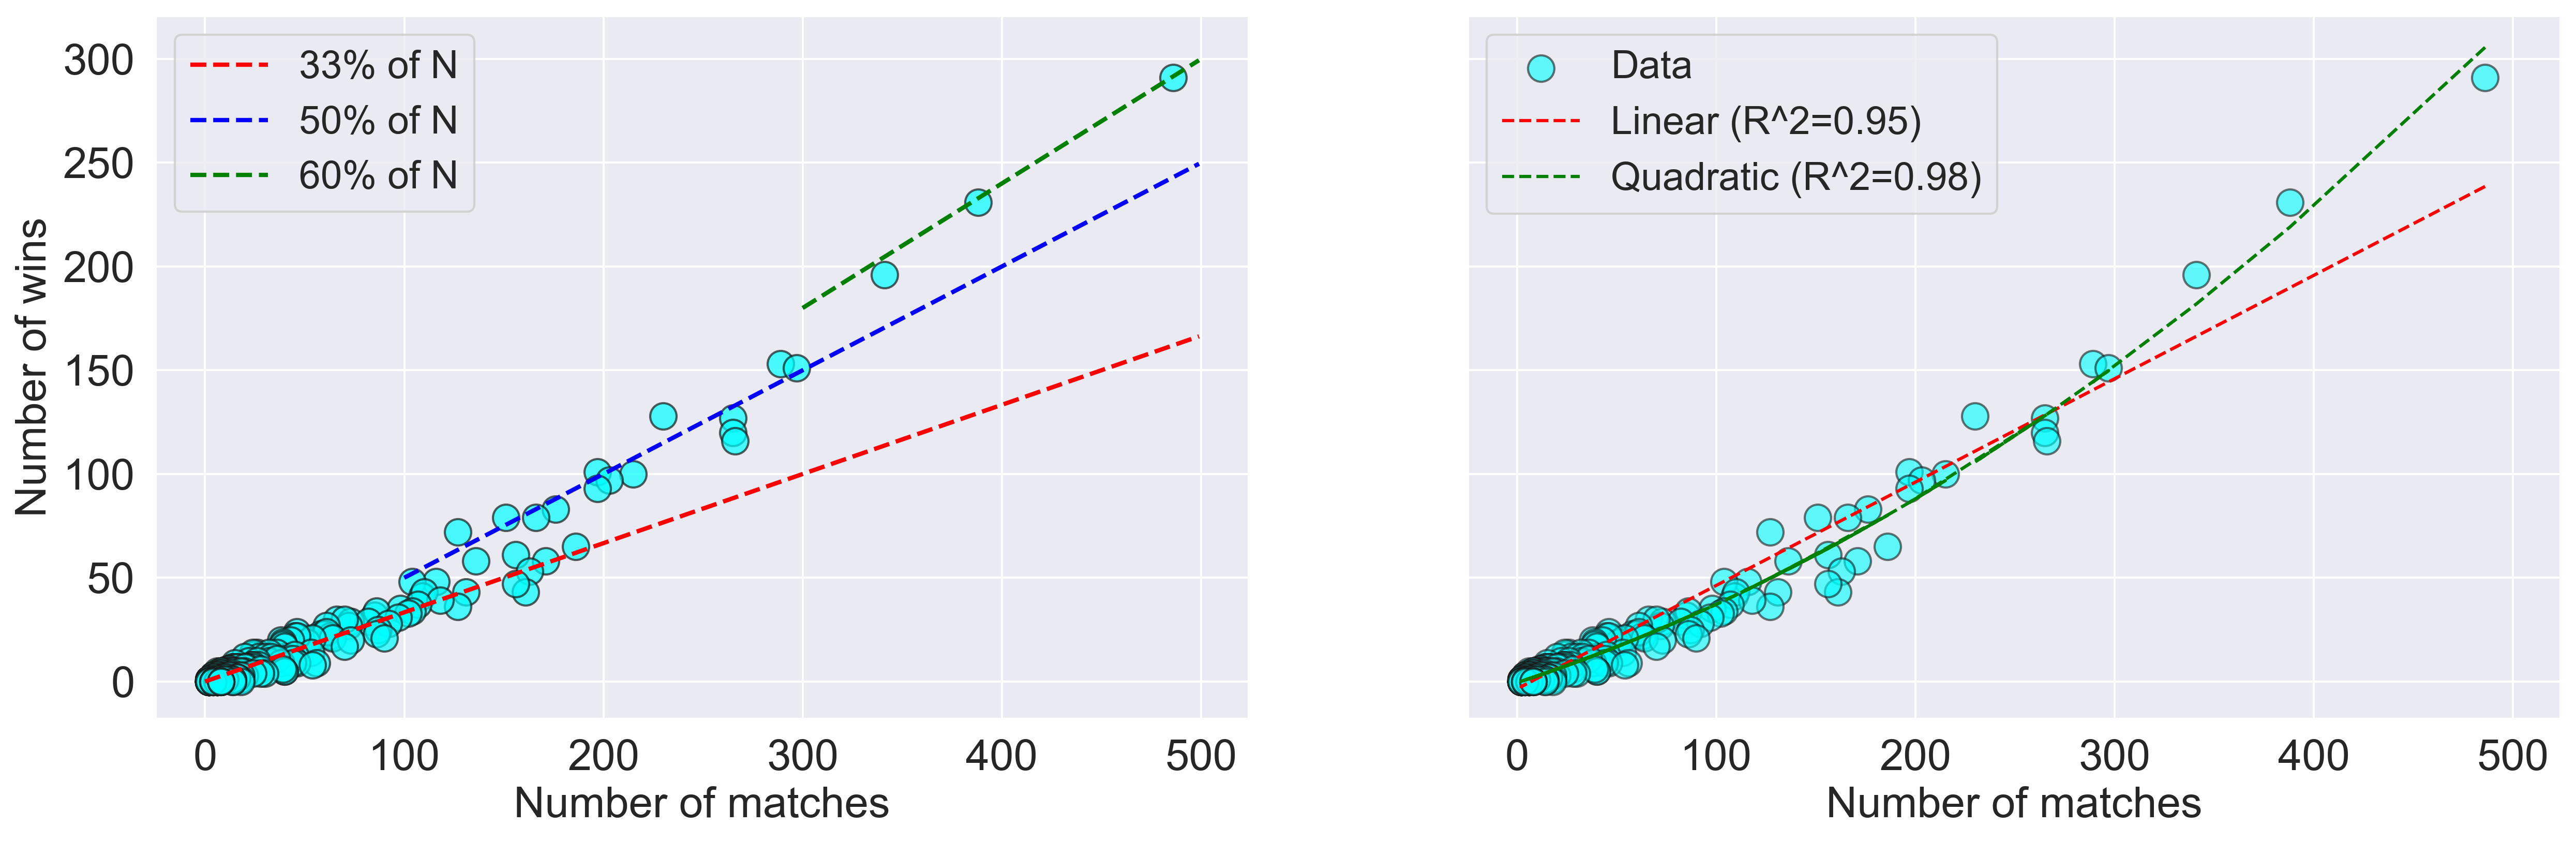
Figure 4: Left panel, distribution of the number of wins against the number of matches alongside linear relationship with coefficient equal to 1/3, 1/2 and 2/3. Right panel, linear and quadratic fit of the data.
This result would make up a zero order step for a Machine Learning predictive algorithm as well as an interesting case of study for behavioral science.
Successively we analyzed the correlation matrix of some features of our dasets as shown in Figure 5 below.
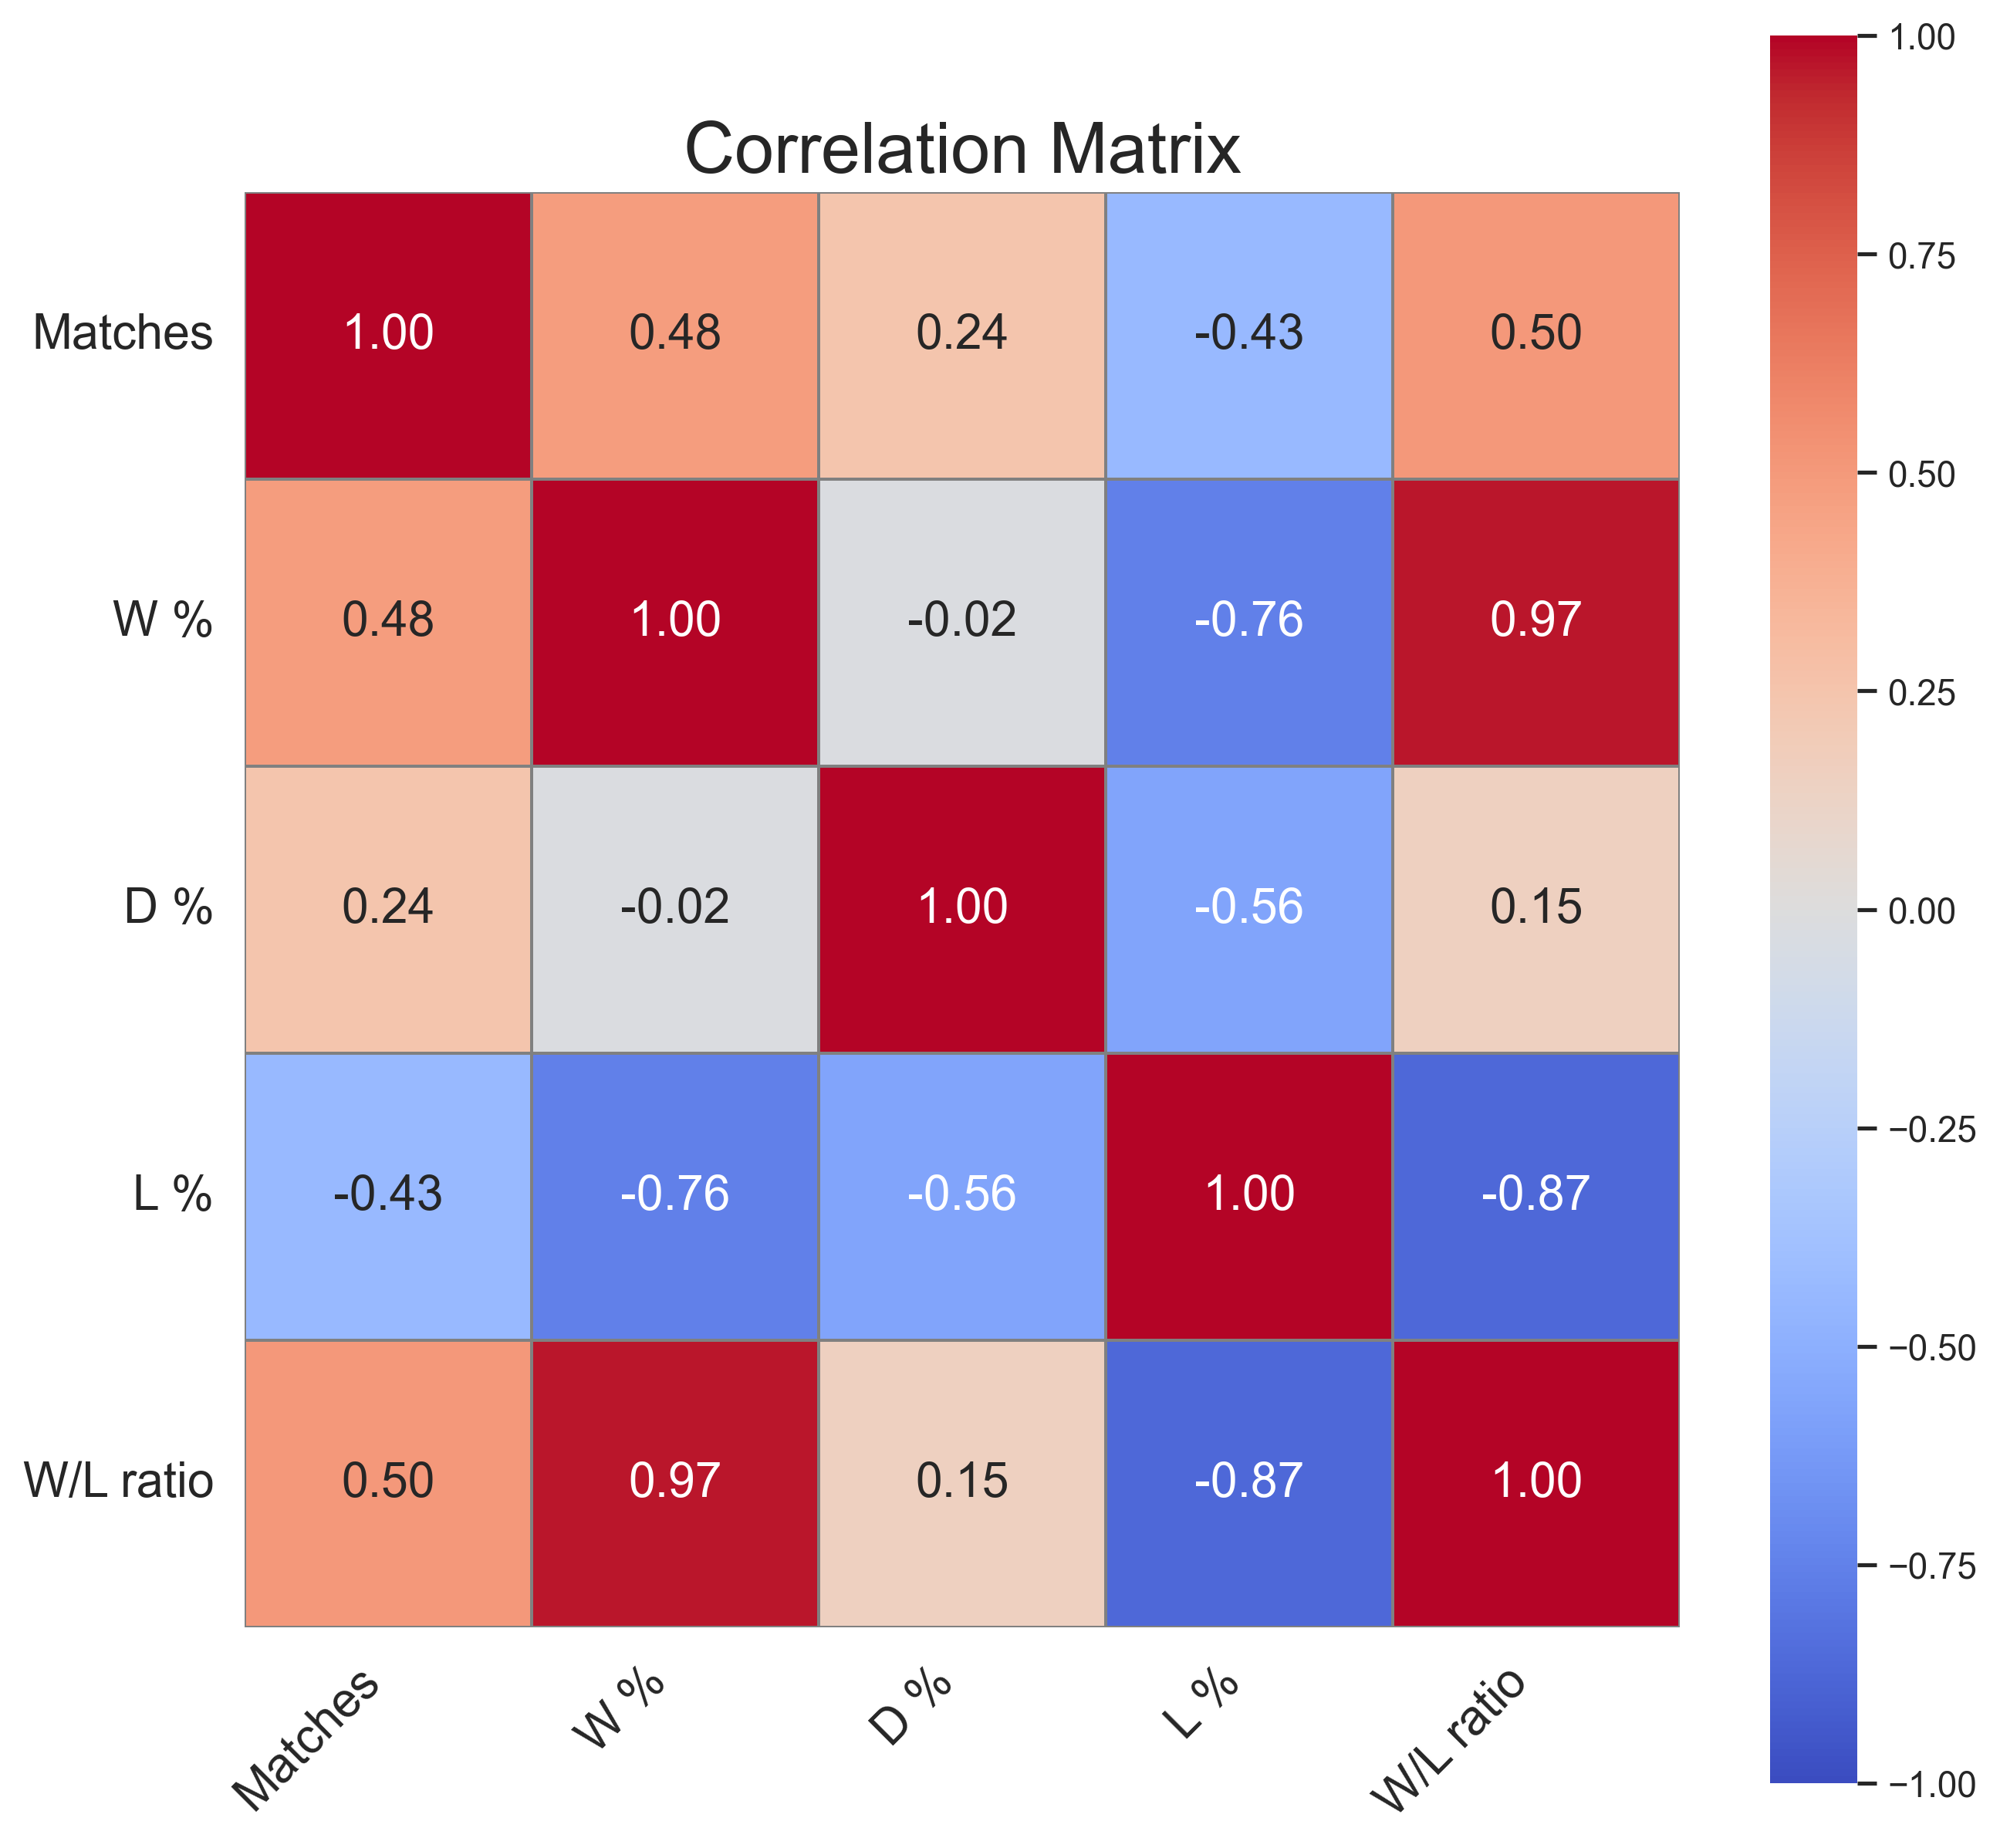
Figure 5: Correlation matrix of the `all_time` dataset.
As expected the number of matches shows a slight positive correlation with the win ratio, as more wins typically result in more matches played. Similarly, the number of matches is negatively correlated with the loss ratio. Indeed, prior to 1991, the UEFA Champions League featured only a knockout format, so a single loss would eliminate a team from the competition. Since 1991, the competition has been revised to include a group stage, which ensures a minimum number of matches before teams advance to the knockout rounds (see UEFA Champions League for reference).
To conclude this subsection, we examined the distribution of UCL titles across Europe and over the years. Our analysis reveals that the distribution of these prestigious trophies is not uniform throughout the continent as highlighted by Figure 6. Rather, the majority of the titles are concentrated in Western Europe. Specifically, Spain leads with 19 titles, followed by England with 15, and Italy with 12. Germany and the Netherlands also have a notable presence, with 9 and 6 titles, respectively.
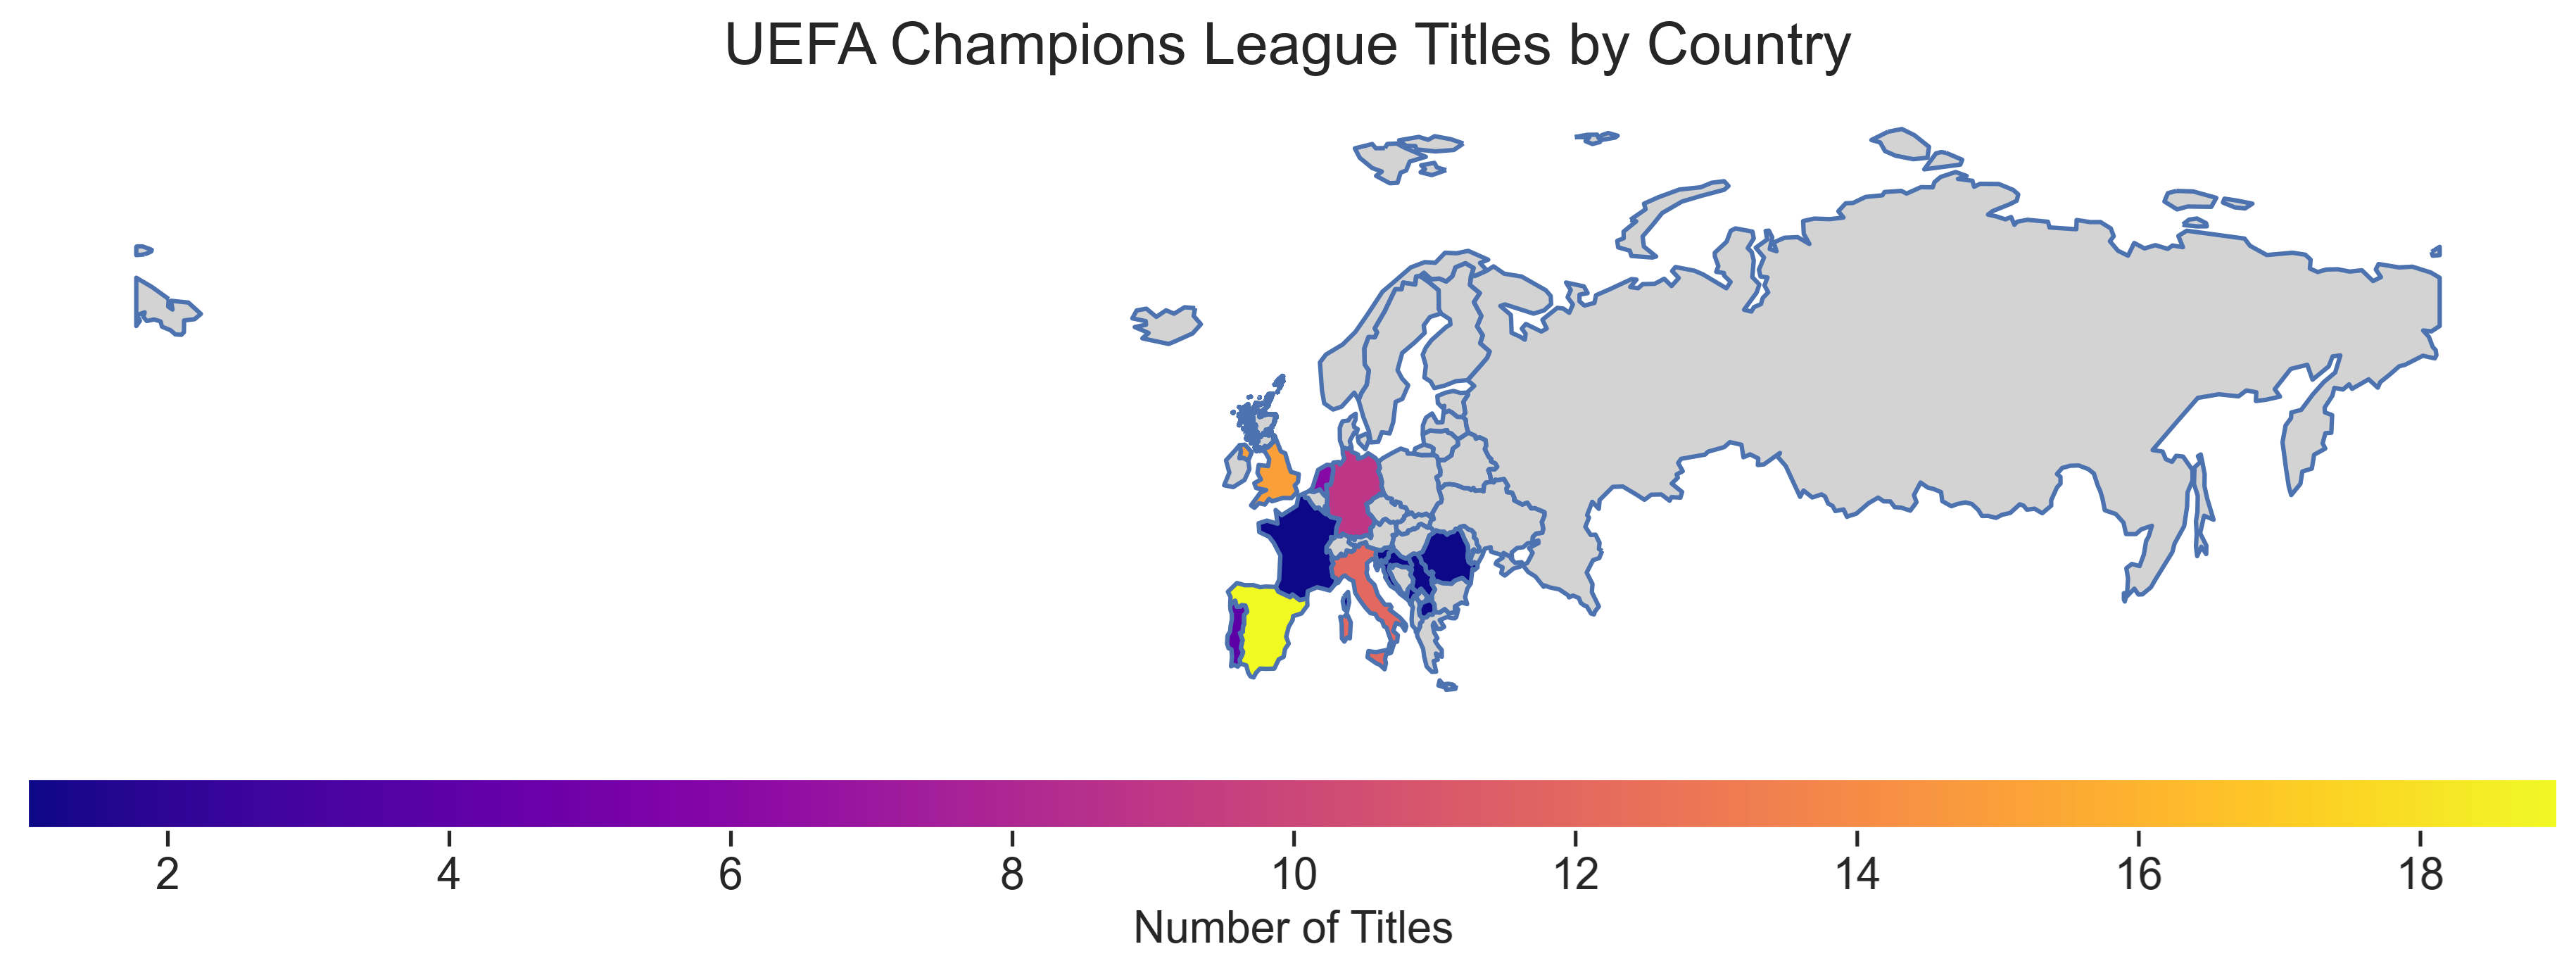
Figure 6: Geospatial distribution of UCL trophies in Europe.
In contrast, Eastern Europe’s representation is minimal. The region’s tally is limited to former Yugoslavian countries—now represented as Slovenia, Croatia, Bosnia and Herzegovina, Montenegro, North Macedonia, and Serbia—along with Romania, each securing just one trophy. This disparity highlights a significant imbalance in the distribution of UCL titles, with Northern Europe also showing a noticeable lack of trophies. This analysis underscores the concentration of UCL success in Western European nations and points to a broader geographical disparity in the distribution of these prestigious awards. The uneven distribution of UEFA Champions League titles across Europe primarily stems from several key factors.
- Financial Power: Western European clubs, particularly from Spain, England, and Italy, have historically had more financial resources, allowing them to invest heavily in top players and facilities;
- Strong Domestic Leagues: competitive domestic leagues in these regions help clubs better prepare for European competitions, contributing to their success.
- Advanced Infrastructure: state-of-the-art stadiums and training facilities in Western Europe enhance team performance;
- Global Scouting Networks: Western European clubs benefit from extensive scouting and recruitment networks, attracting top global talent;
- Historical Success: past achievements boost the reputation and appeal of clubs from these regions, creating a self-reinforcing cycle of success; In contrast, Eastern and Northern European clubs face economic and infrastructural challenges that limit their ability to compete at the highest level.
Lastly we also analyzed the distribution of UCL titles per country across the years as depicted in Figure 7.
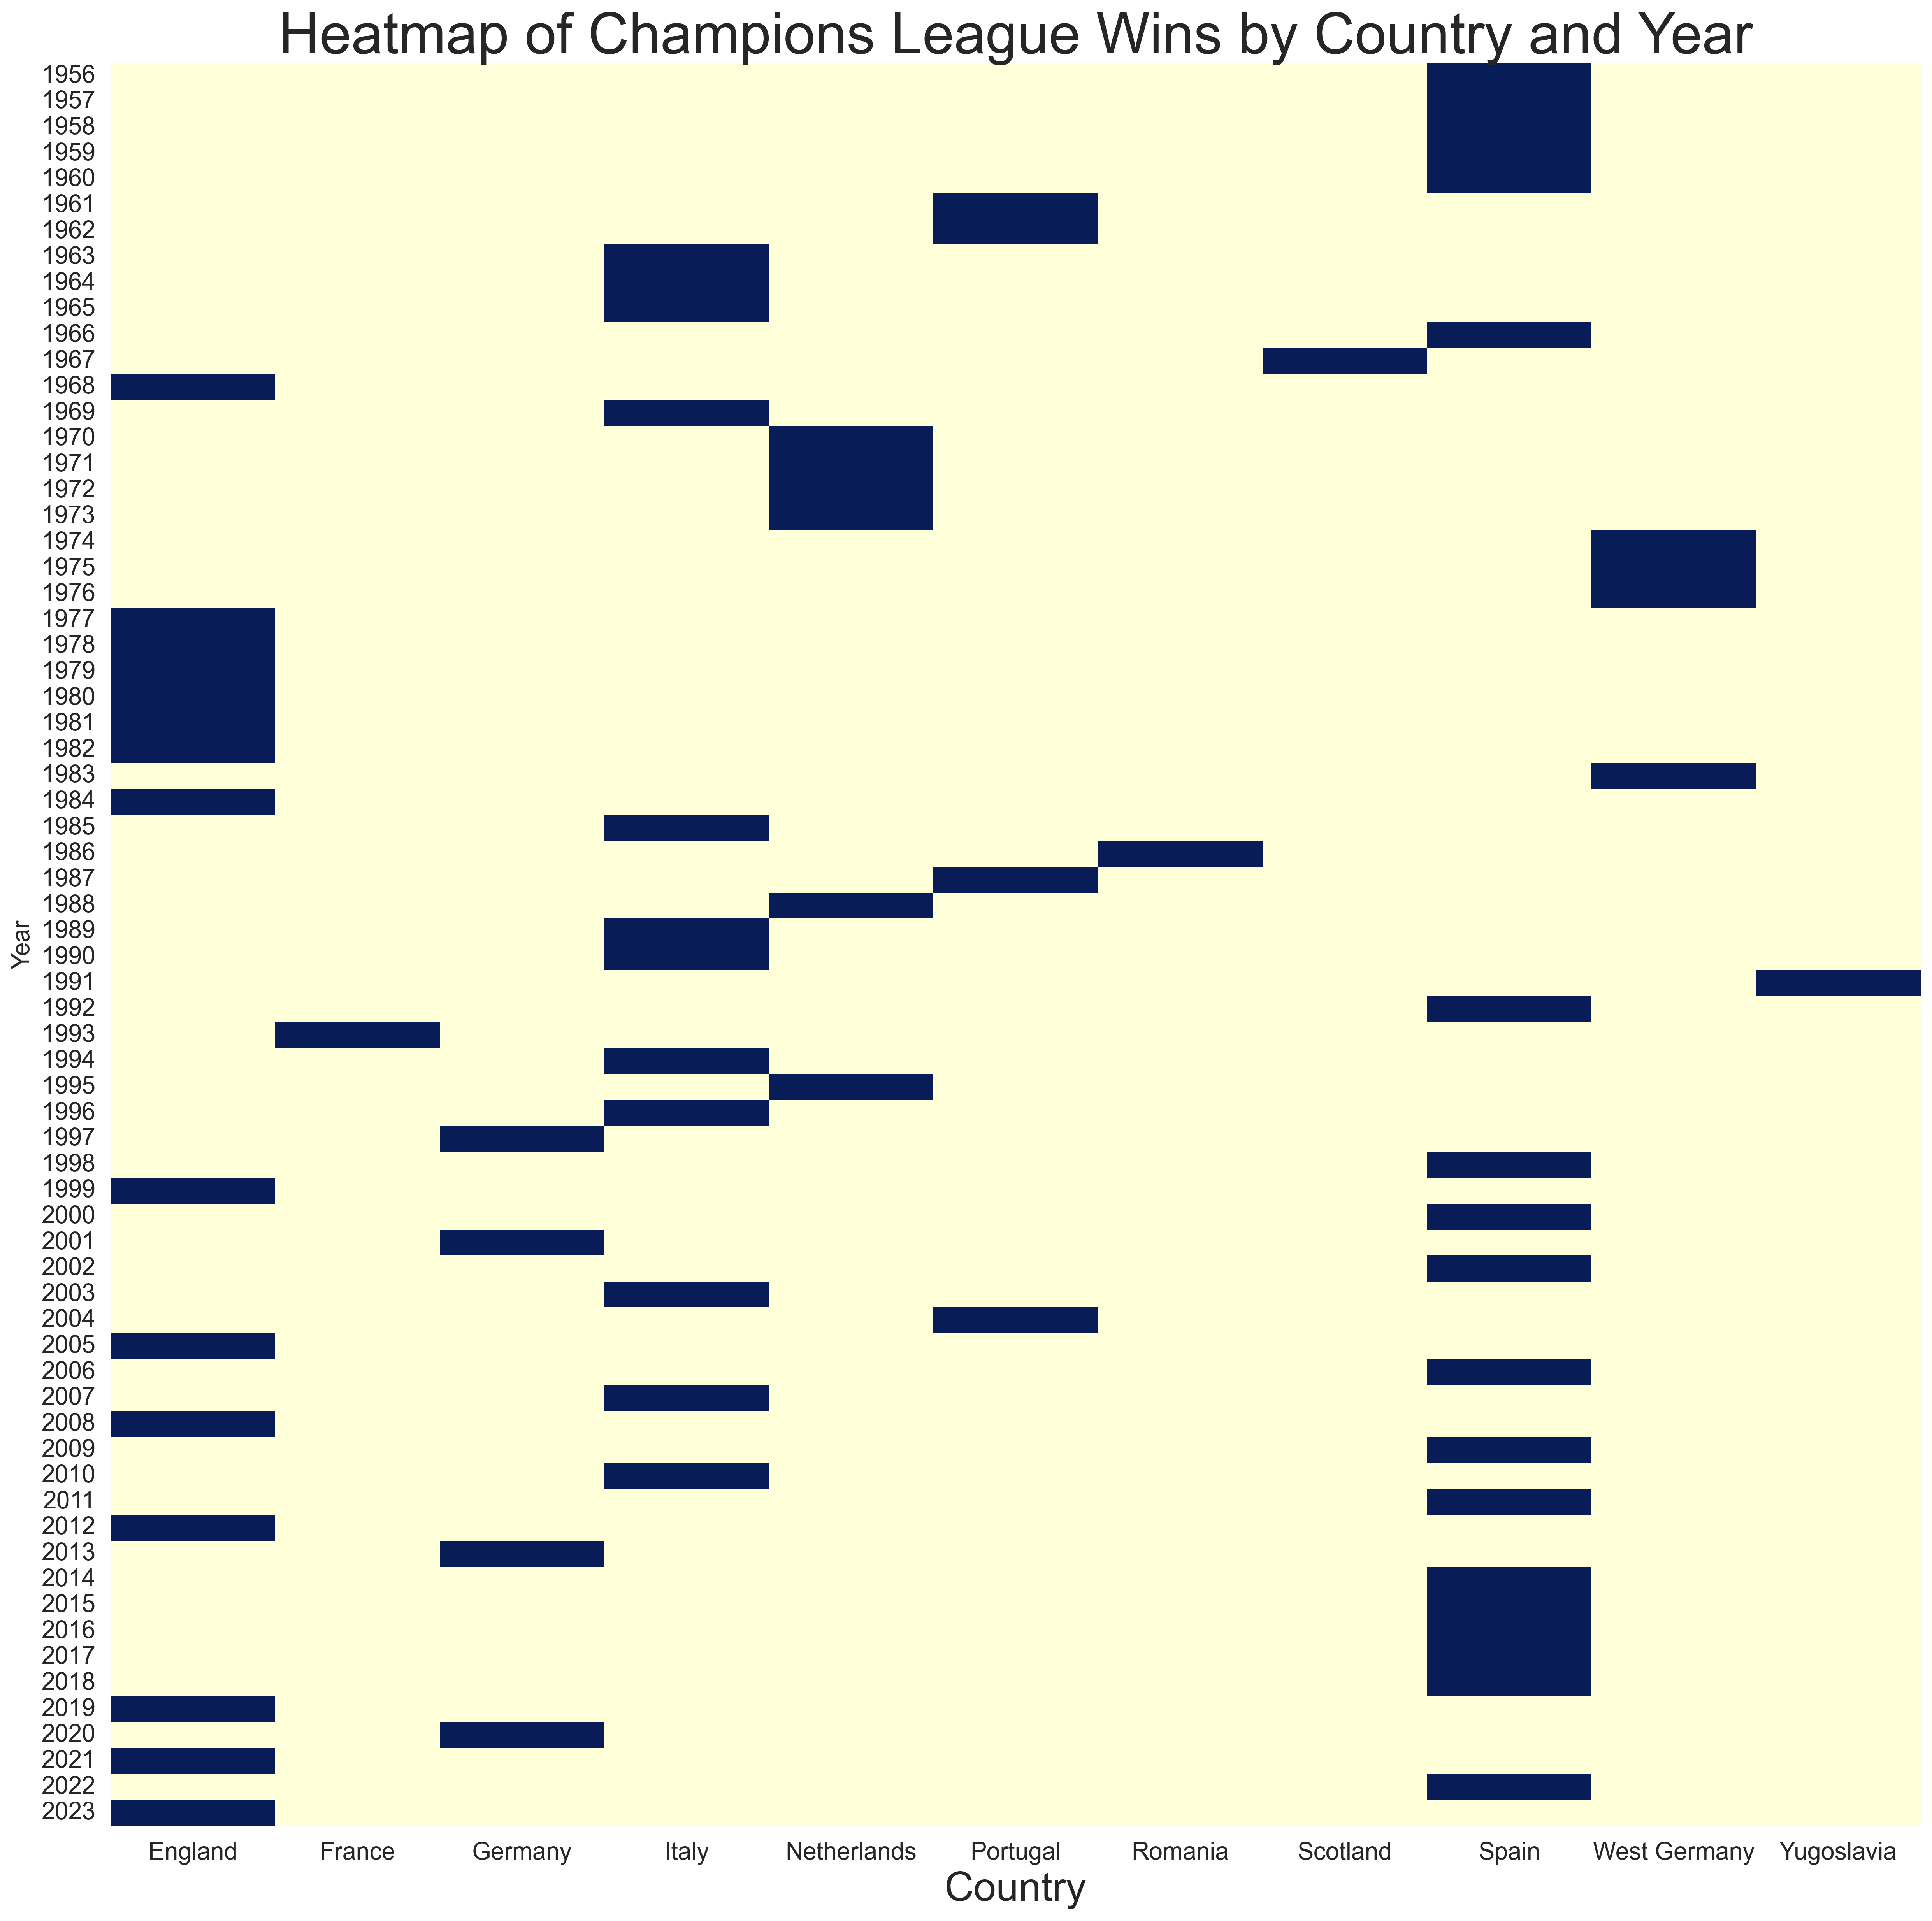
Figure 7: UCL final attendance over the years.
The competition began with a dominating five-year stretch by Spain, led predominantly by Real Madrid. Their unprecedented winning streak, however, was disrupted in 1960 when Benfica from Portugal emerged victorious, securing the title again the following year and showcasing their prowess on the European stage. Following this period, Italy began to assert itself in European football, with Milan and Inter Milan each claiming the trophy over the next three years, marking a significant shift in power. This was followed by a period of fluctuation, with various countries—Spain, Scotland, England, and Italy—each enjoying spells of success. The uncertainty was eventually halted by an extraordinary four-year run from the Netherlands (1969-70, 1971-73), with Feyenoord and Ajax dominating the scene. This Dutch dominance set the stage for a new era, as European football witnessed the rise of English and German teams up until 1983. From 1984 onwards, the competition entered a phase of remarkable unpredictability, characterized by a wide array of winners and no dominant streak lasting more than two decades. This era saw many teams capturing their first UEFA Champions League titles, reflecting a period of intense competition and emerging talent. Despite the volatility, Spanish clubs, particularly Real Madrid and FC Barcelona, along with Italian and English teams, consistently made their mark, maintaining their presence at the top. The landscape shifted again in 2014, marking the beginning of a new Spanish era. Real Madrid and FC Barcelona took center stage, with Real Madrid securing the title six times. This period of Spanish dominance was occasionally interrupted by English clubs—Liverpool, Chelsea, and Manchester City—as well as by Bayern Munich from Germany. The prominence of these teams underscores a broader trend: today, the most successful and prestigious clubs are found in the Premier League (England) and La Liga (Spain), reflecting their ongoing influence and supremacy in European football.
Finals analysis
Scores and goals
We keep our analysis by examining the available information about the UCL finals from 1955 to 2023. We started by observing that the most common score during a UCL final is 1-0 that occurred 19 times out of 69 finals (nearly 27 %) as shown in Figure 8.
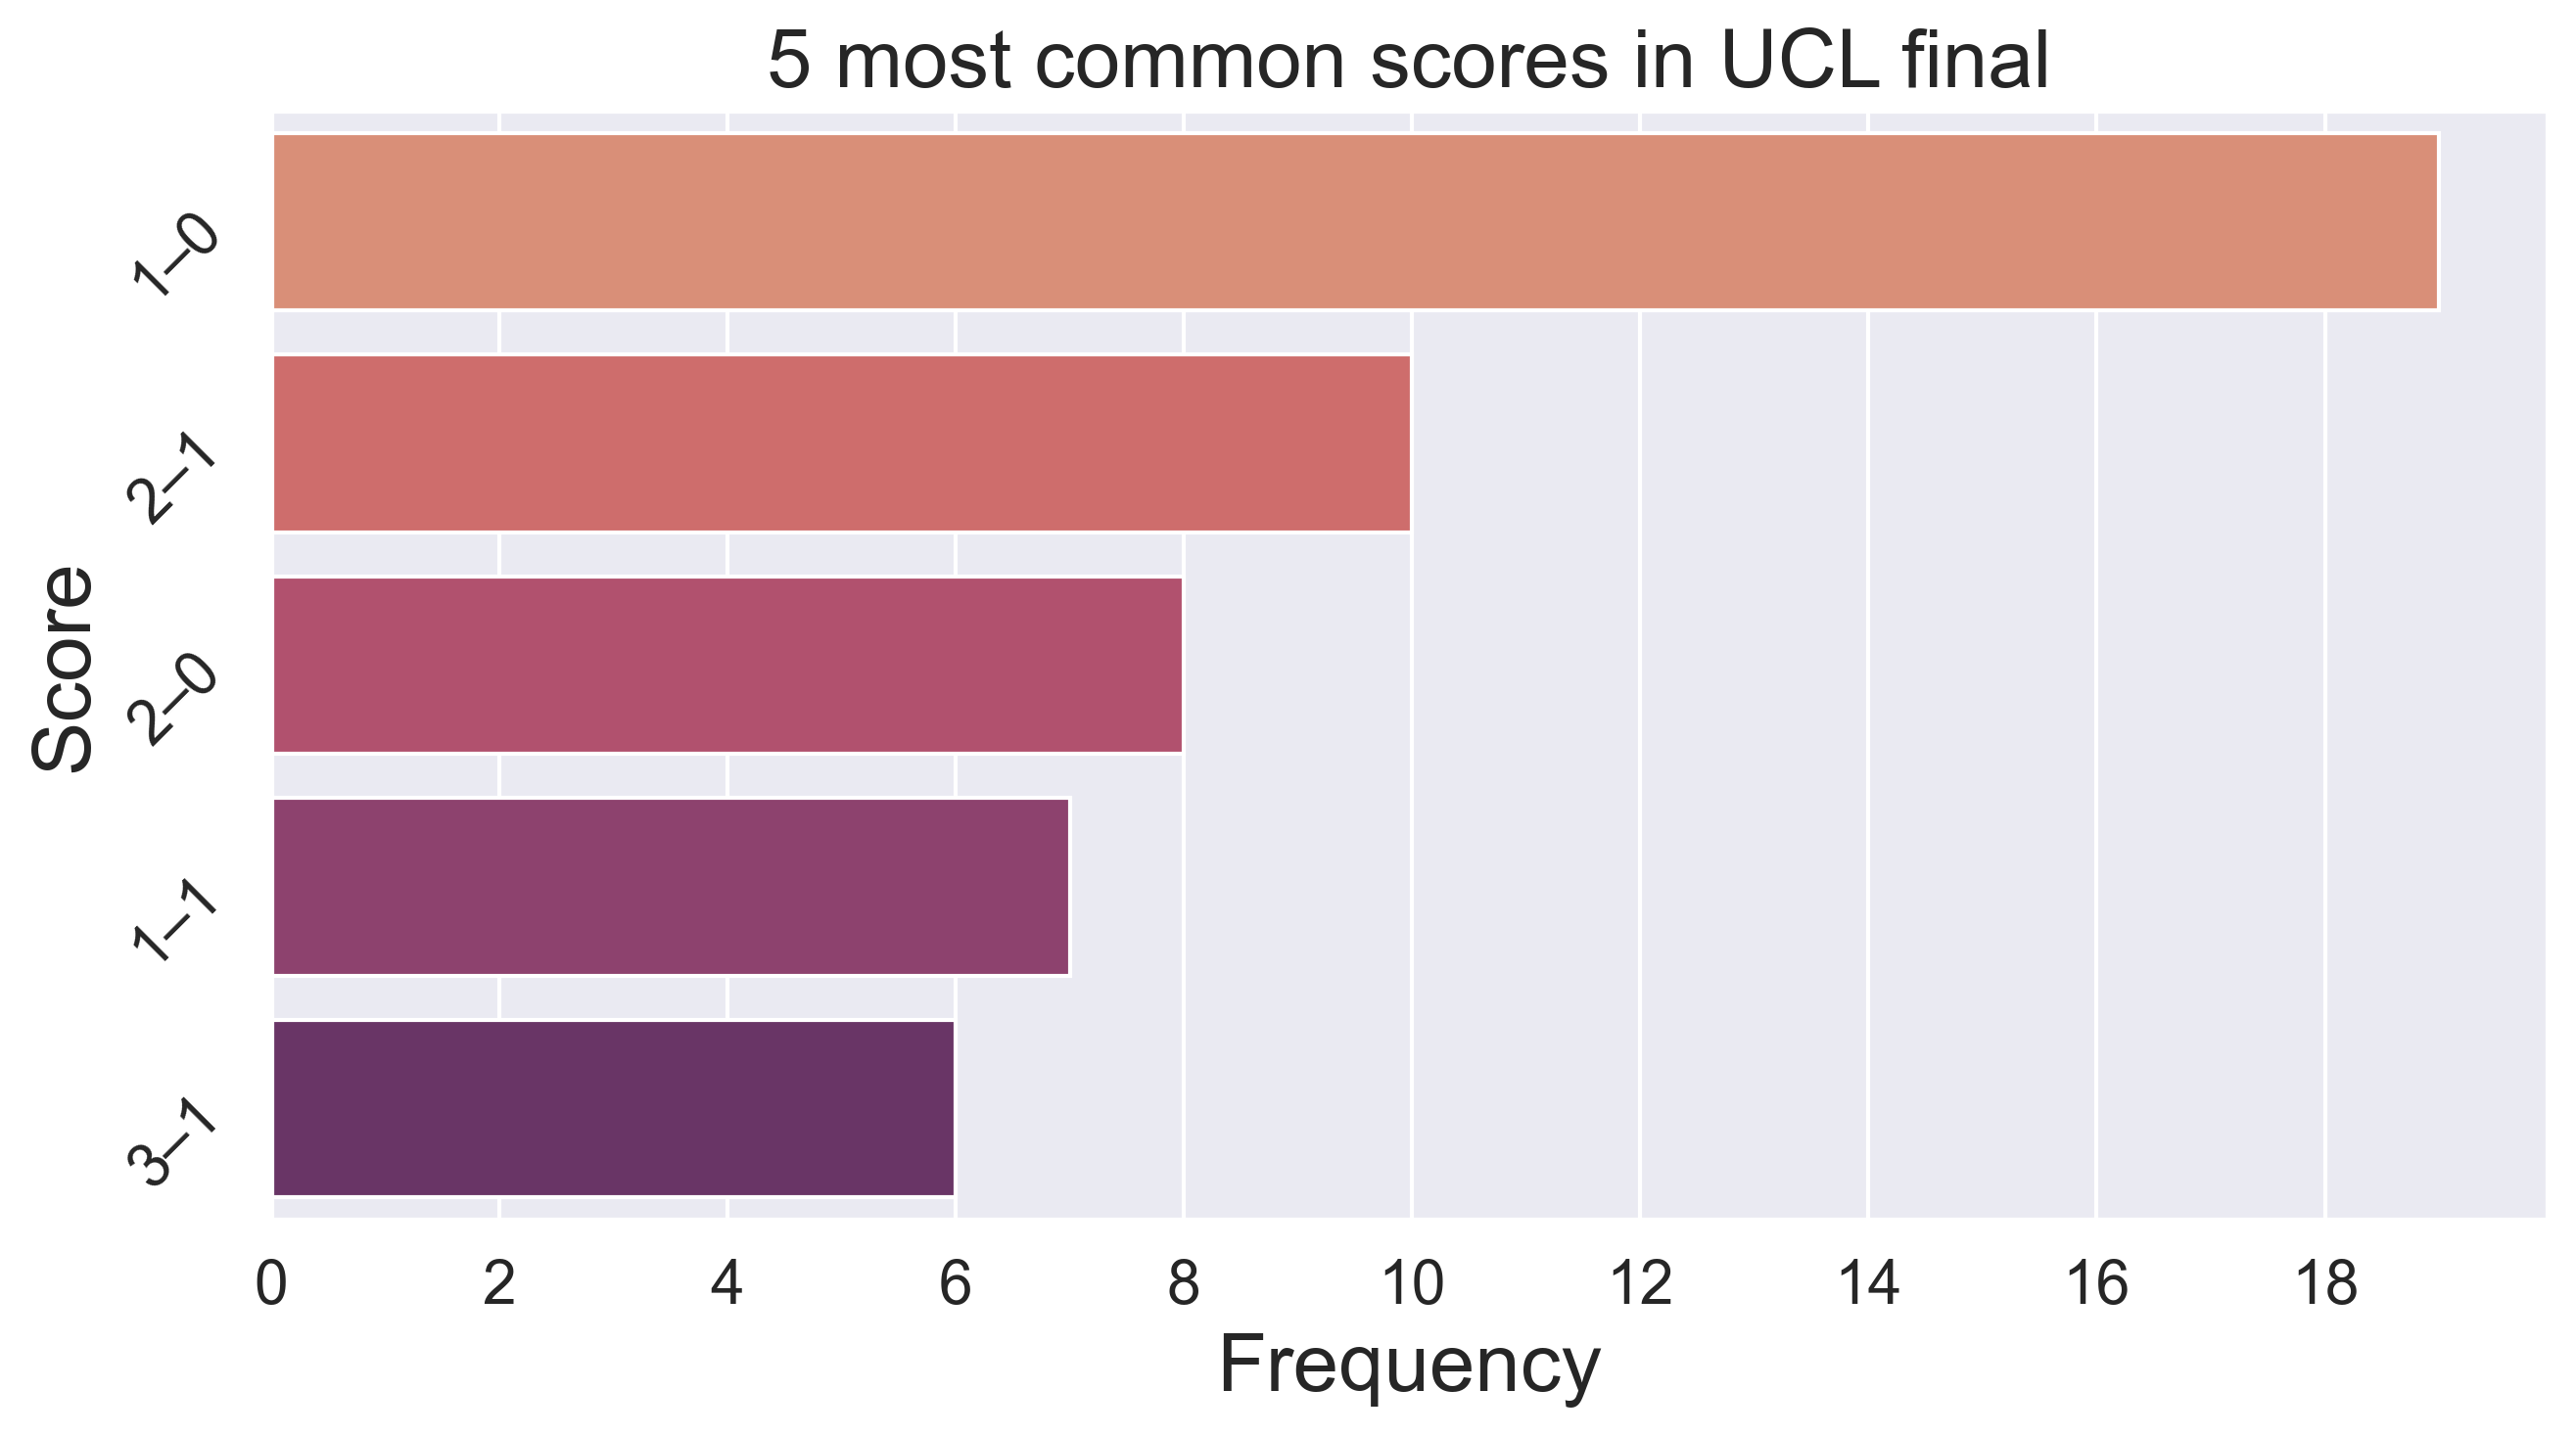
Figure 8: Top five scores in a UCL final.
A 1-0 scoreline indicates a tightly contested match, reflecting the high stakes and defensive strategies typical of UCL finals. Teams in these high-pressure games often prioritize solid defense and tactical discipline, leading to fewer goals. This scoreline suggests that the finalists are well-matched, with defenses usually able to contain the attacking play, and a single goal often proving sufficient to secure victory.
Historically, UCL finals have often been decided by narrow margins, in fact 2-1 and 2-0 are respectively the second and third most frequent score (10 and 8 times respectively). This trend may reflect the competitive nature of the tournament, where the difference in quality between teams is minimal, leading to close encounters. However, it’s also worth considering that tactics and game strategies evolve, and what has been observed in past finals might change as teams adapt their approaches to match the modern game. In this regard, Figure 9 shows the mean total goals scored during a UCL final per decade.
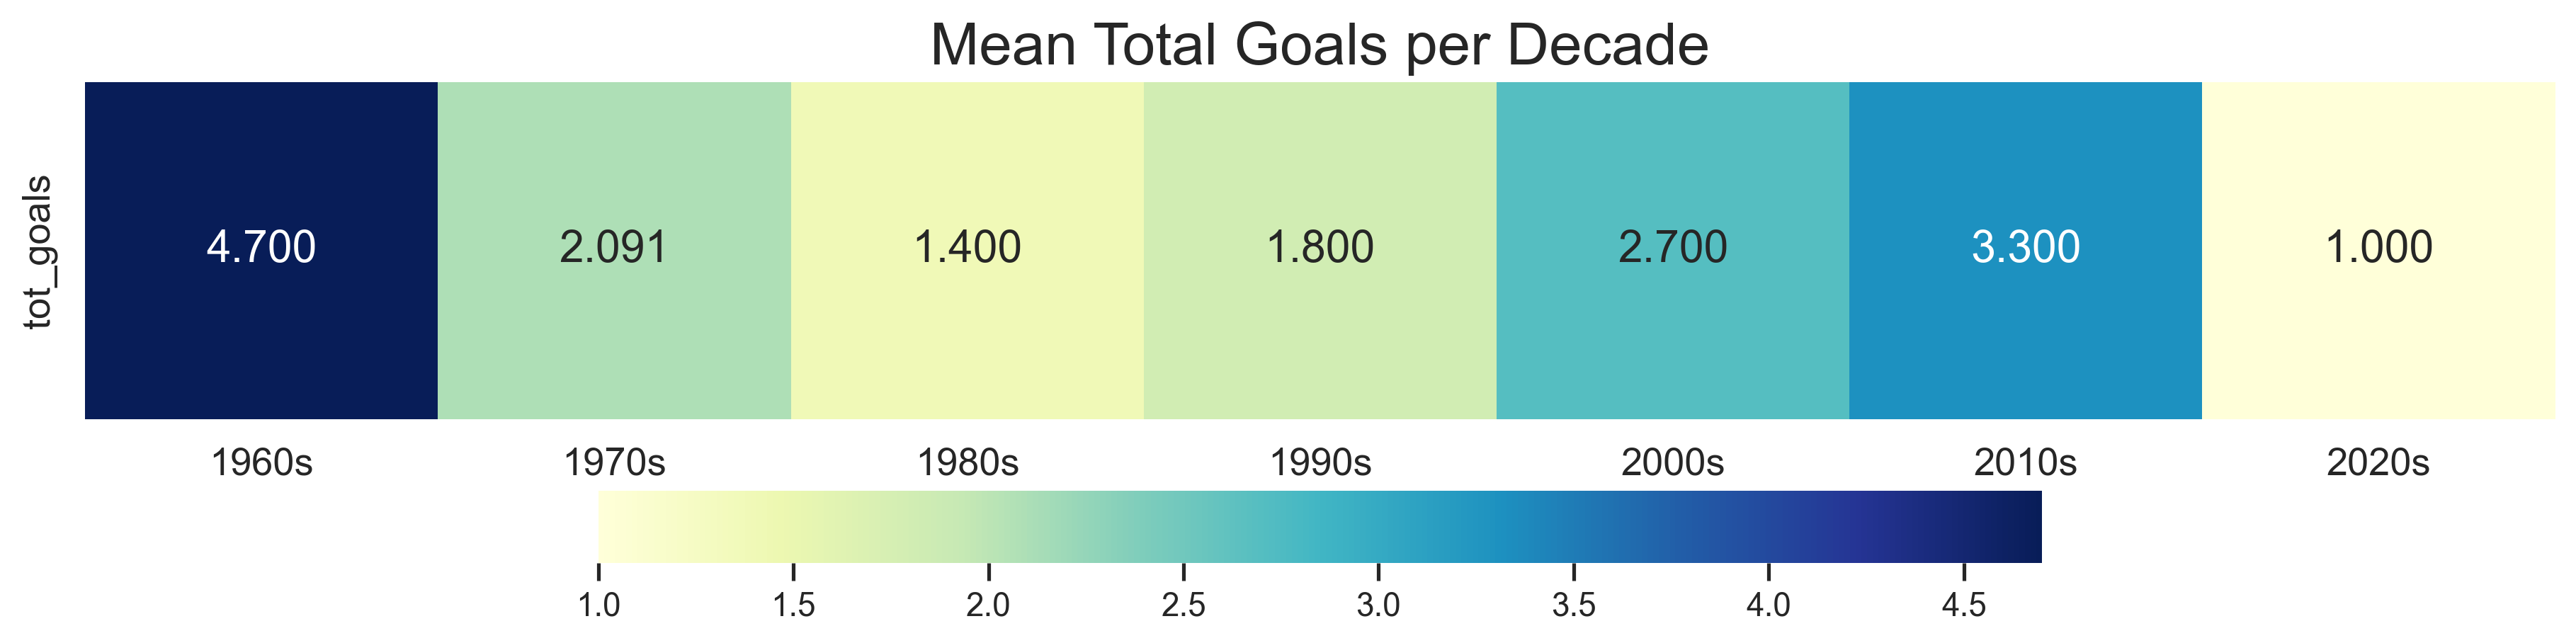
Figure 9: Mean total goals in a UCL final per decade.
The 1960s were particularly prolific, highlighted by the thrilling 7-3 showdown between Real Madrid and Eintracht Frankfurt, a standout victory for Los Blancos. Over the decades, however, there has been a noticeable fluctuation in goal-scoring, with the 1980s and 2020s emerging as the least prolific periods, averaging just 1.40 and 1.00 total goals per match, respectively. We argue that 2020s only consist of three matches (Chelsea FC - Manchester City 1–0, Real Madrid - Liverpool FC 1-0 and Manchester City - Inter Milan 1-0) with respect to the 10 matches of the 1980s. The fluctuations in UCL final’s goal-scoring over the years might be attributed to different factors and their complex combination.
- Tactical Evolution: football tactics have evolved significantly over the decades. In earlier years, teams often favored more attacking styles, leading to higher-scoring games. As the game evolved, many teams adopted more defensive, strategic approaches, especially in high-stakes finals, resulting in fewer goals;
- Physical and Technical Development: over time, players have become more physically fit and technically proficient, allowing teams to execute more complex defensive strategies. The increased fitness levels also mean players can maintain a high level of defensive intensity throughout the match;
- Offensive Innovations: during the 2000s and 2010s, football saw the emergence of more dynamic and versatile attacking strategies. Teams like Barcelona under Pep Guardiola, and later Real Madrid, focused on high-tempo, possession-based, and counter-attacking football, which often led to more open and higher-scoring games;
- Star Players and Super Teams: these decades were characterized by the rise of “super teams” with an abundance of world-class attacking talent. The presence of players like Lionel Messi, Cristiano Ronaldo, and other top forwards meant that finals were often decided by moments of individual brilliance, leading to more goals;
- Advances in Sports Science: improvements in sports science, fitness, and recovery might have allowed players to maintain higher intensity levels throughout the game, contributing to more dynamic and open matches with greater goal-scoring potential.
We stress that these are only a few possible factors influencing the total goal scored in a UCL final across the years. However, there exist many other random or psychological factors which highly influence the final result.
Figure 10 reveals that the majority of matches, 51 out of 69, have been decided during regular time, showcasing the dominance of teams in securing a result within the standard 90 minutes. However, for more evenly matched finals, the outcome has extended beyond regular time: 11 finals were decided by penalty shoot-outs, 5 in extra time, and 2 required a replay. These statistics highlight the intense and competitive nature of the tournament, where a significant number of finals required additional time to determine a winner.
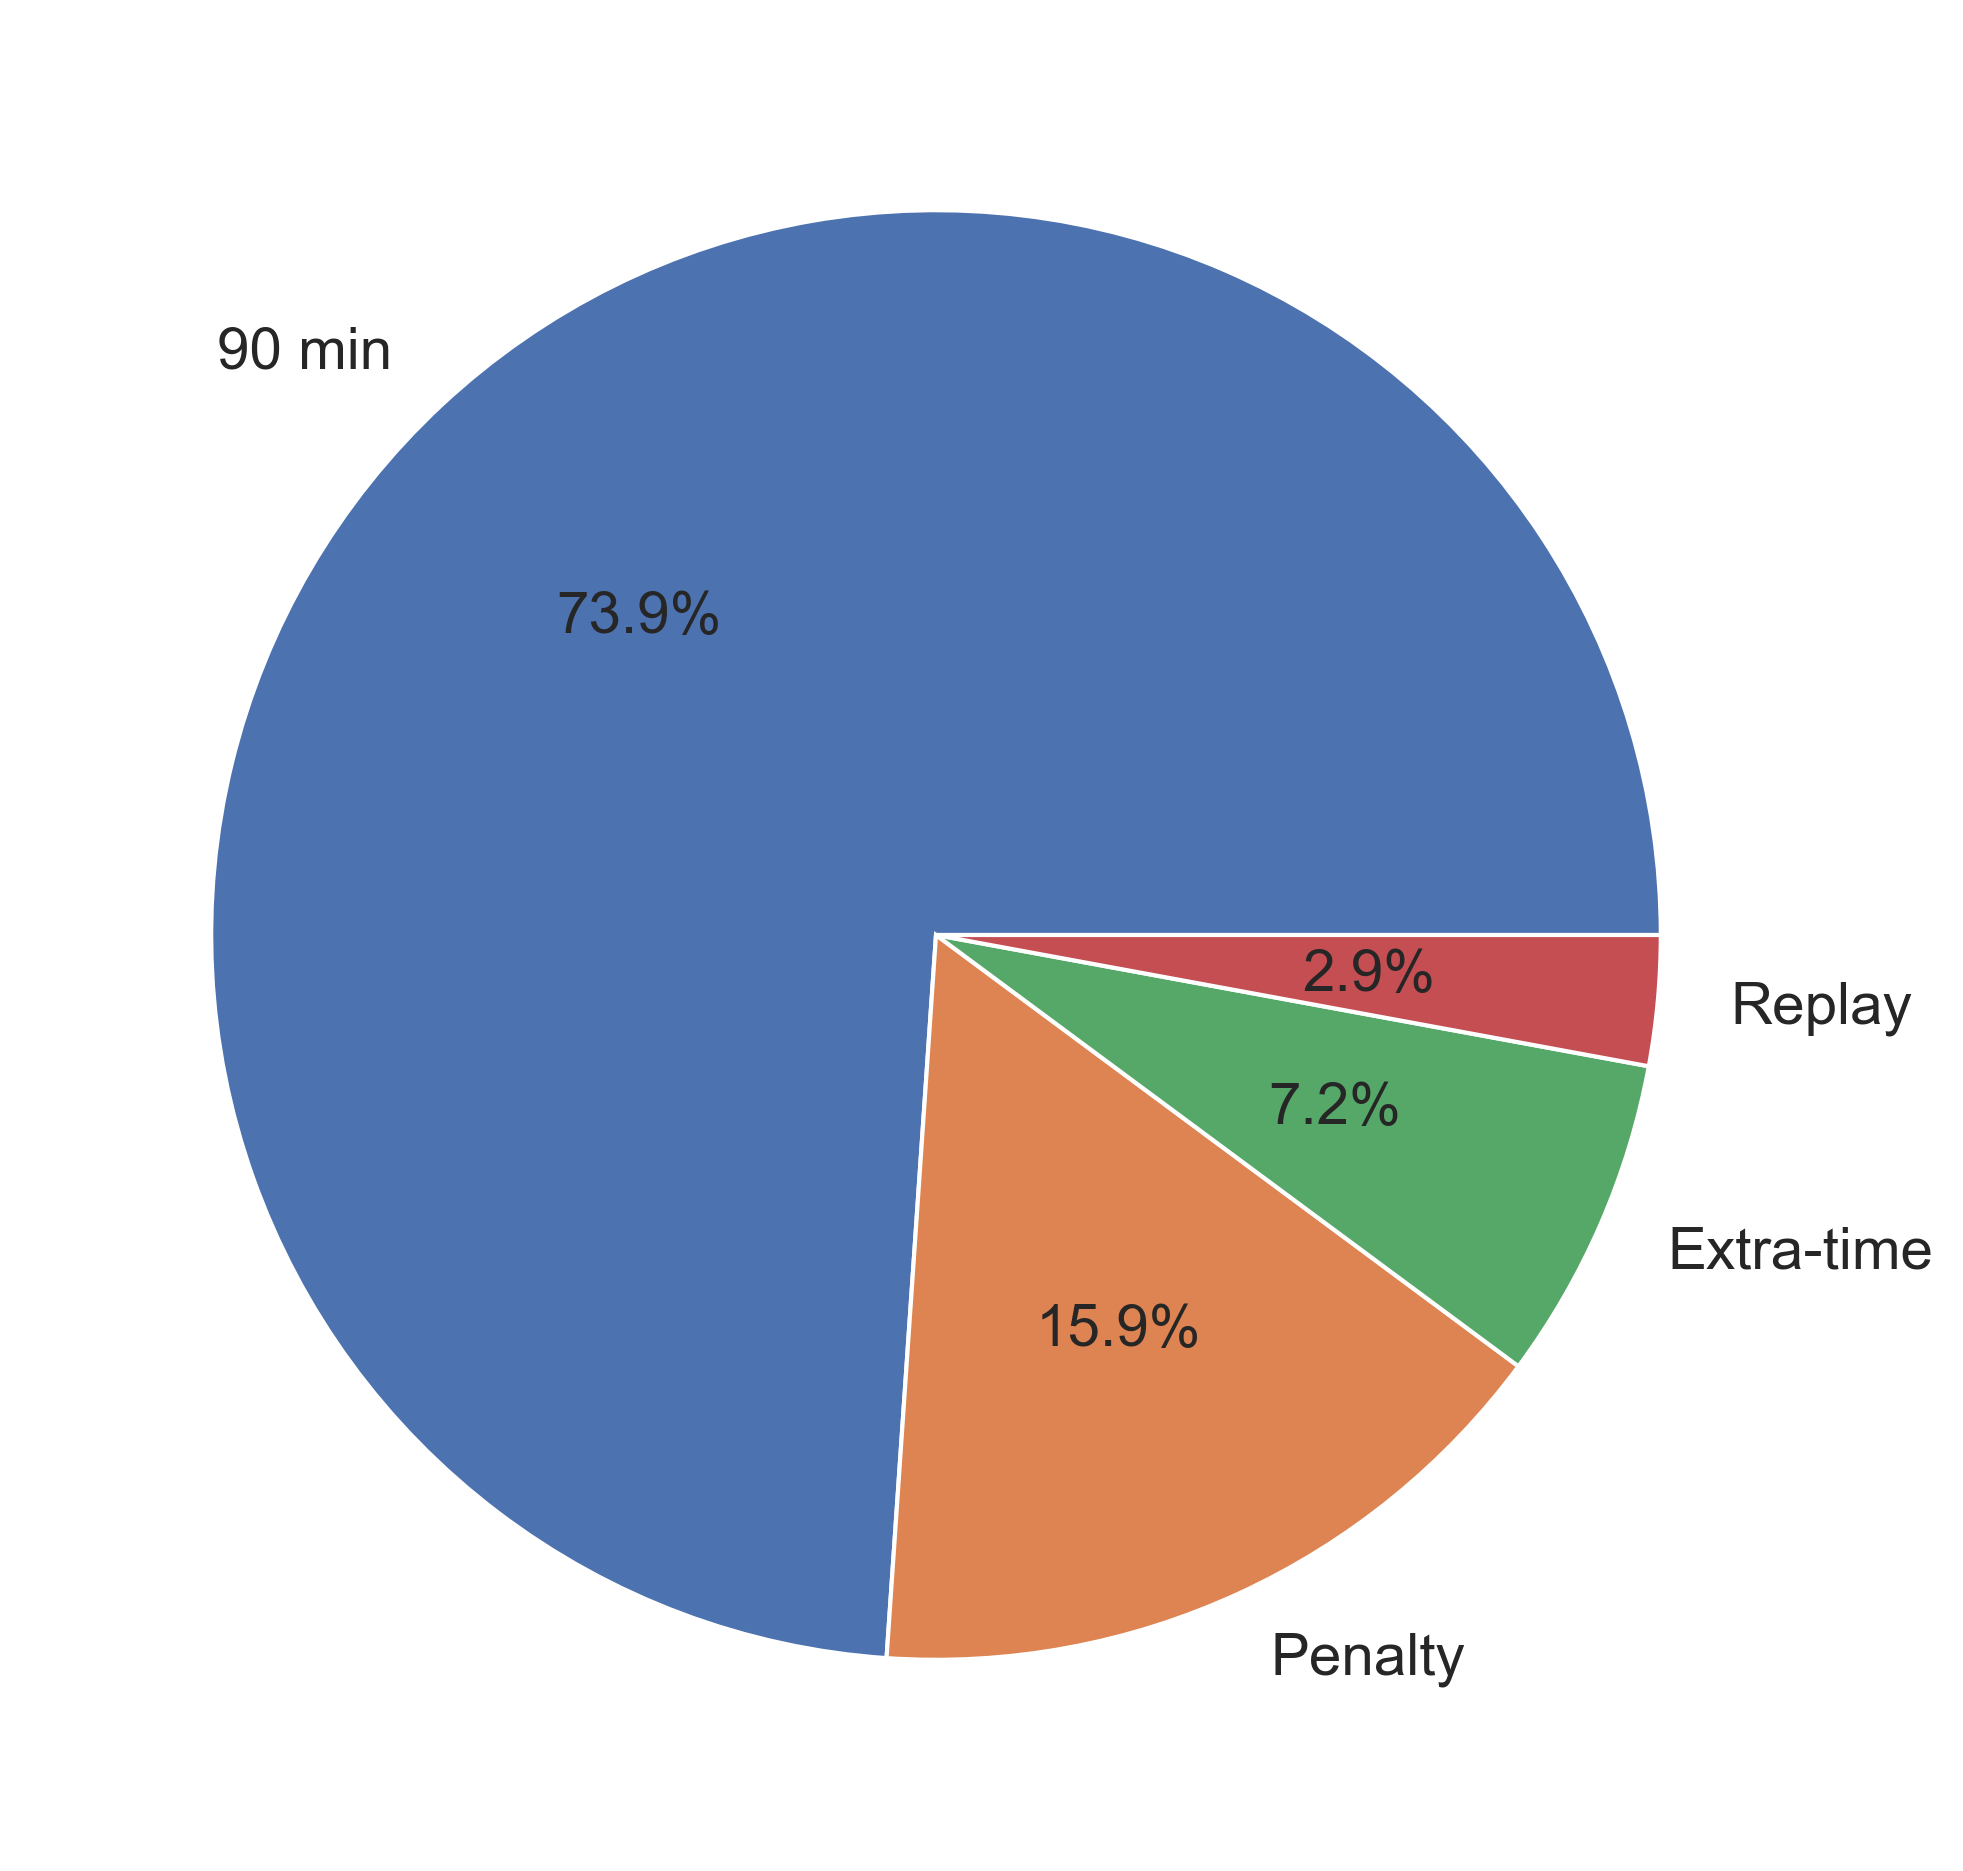
Figure 10: UCL Finals by how the matches were decided.
Next, we sought to determine whether playing a UEFA Champions League final in one’s home country offers any psychological advantage.

Figure 11: Wins and losses of home team during UCL final.
As shown in Figure 11, teams playing on home soil have won the UCL final 58.3% of the time, compared to a 41.7% loss rate. This was expected since the familiarity with the stadium, local climate, and pitch conditions likely give the home team a physical advantage. Additionally, the psychological boost from having the majority of the crowd’s support can enhance player performance and confidence. These elements, combined with reduced travel fatigue, might contribute to the observed increase in success for home-country teams.
The home-field advantage is also evident in the number of goals scored by the home team compared to those by the visiting team.
Figure 12 clearly shows that the distribution of goals for the home team is skewed towards higher values. Indeed, the mean value of total goals scored by the home team is 1.67 compared to 1 for visiting club.
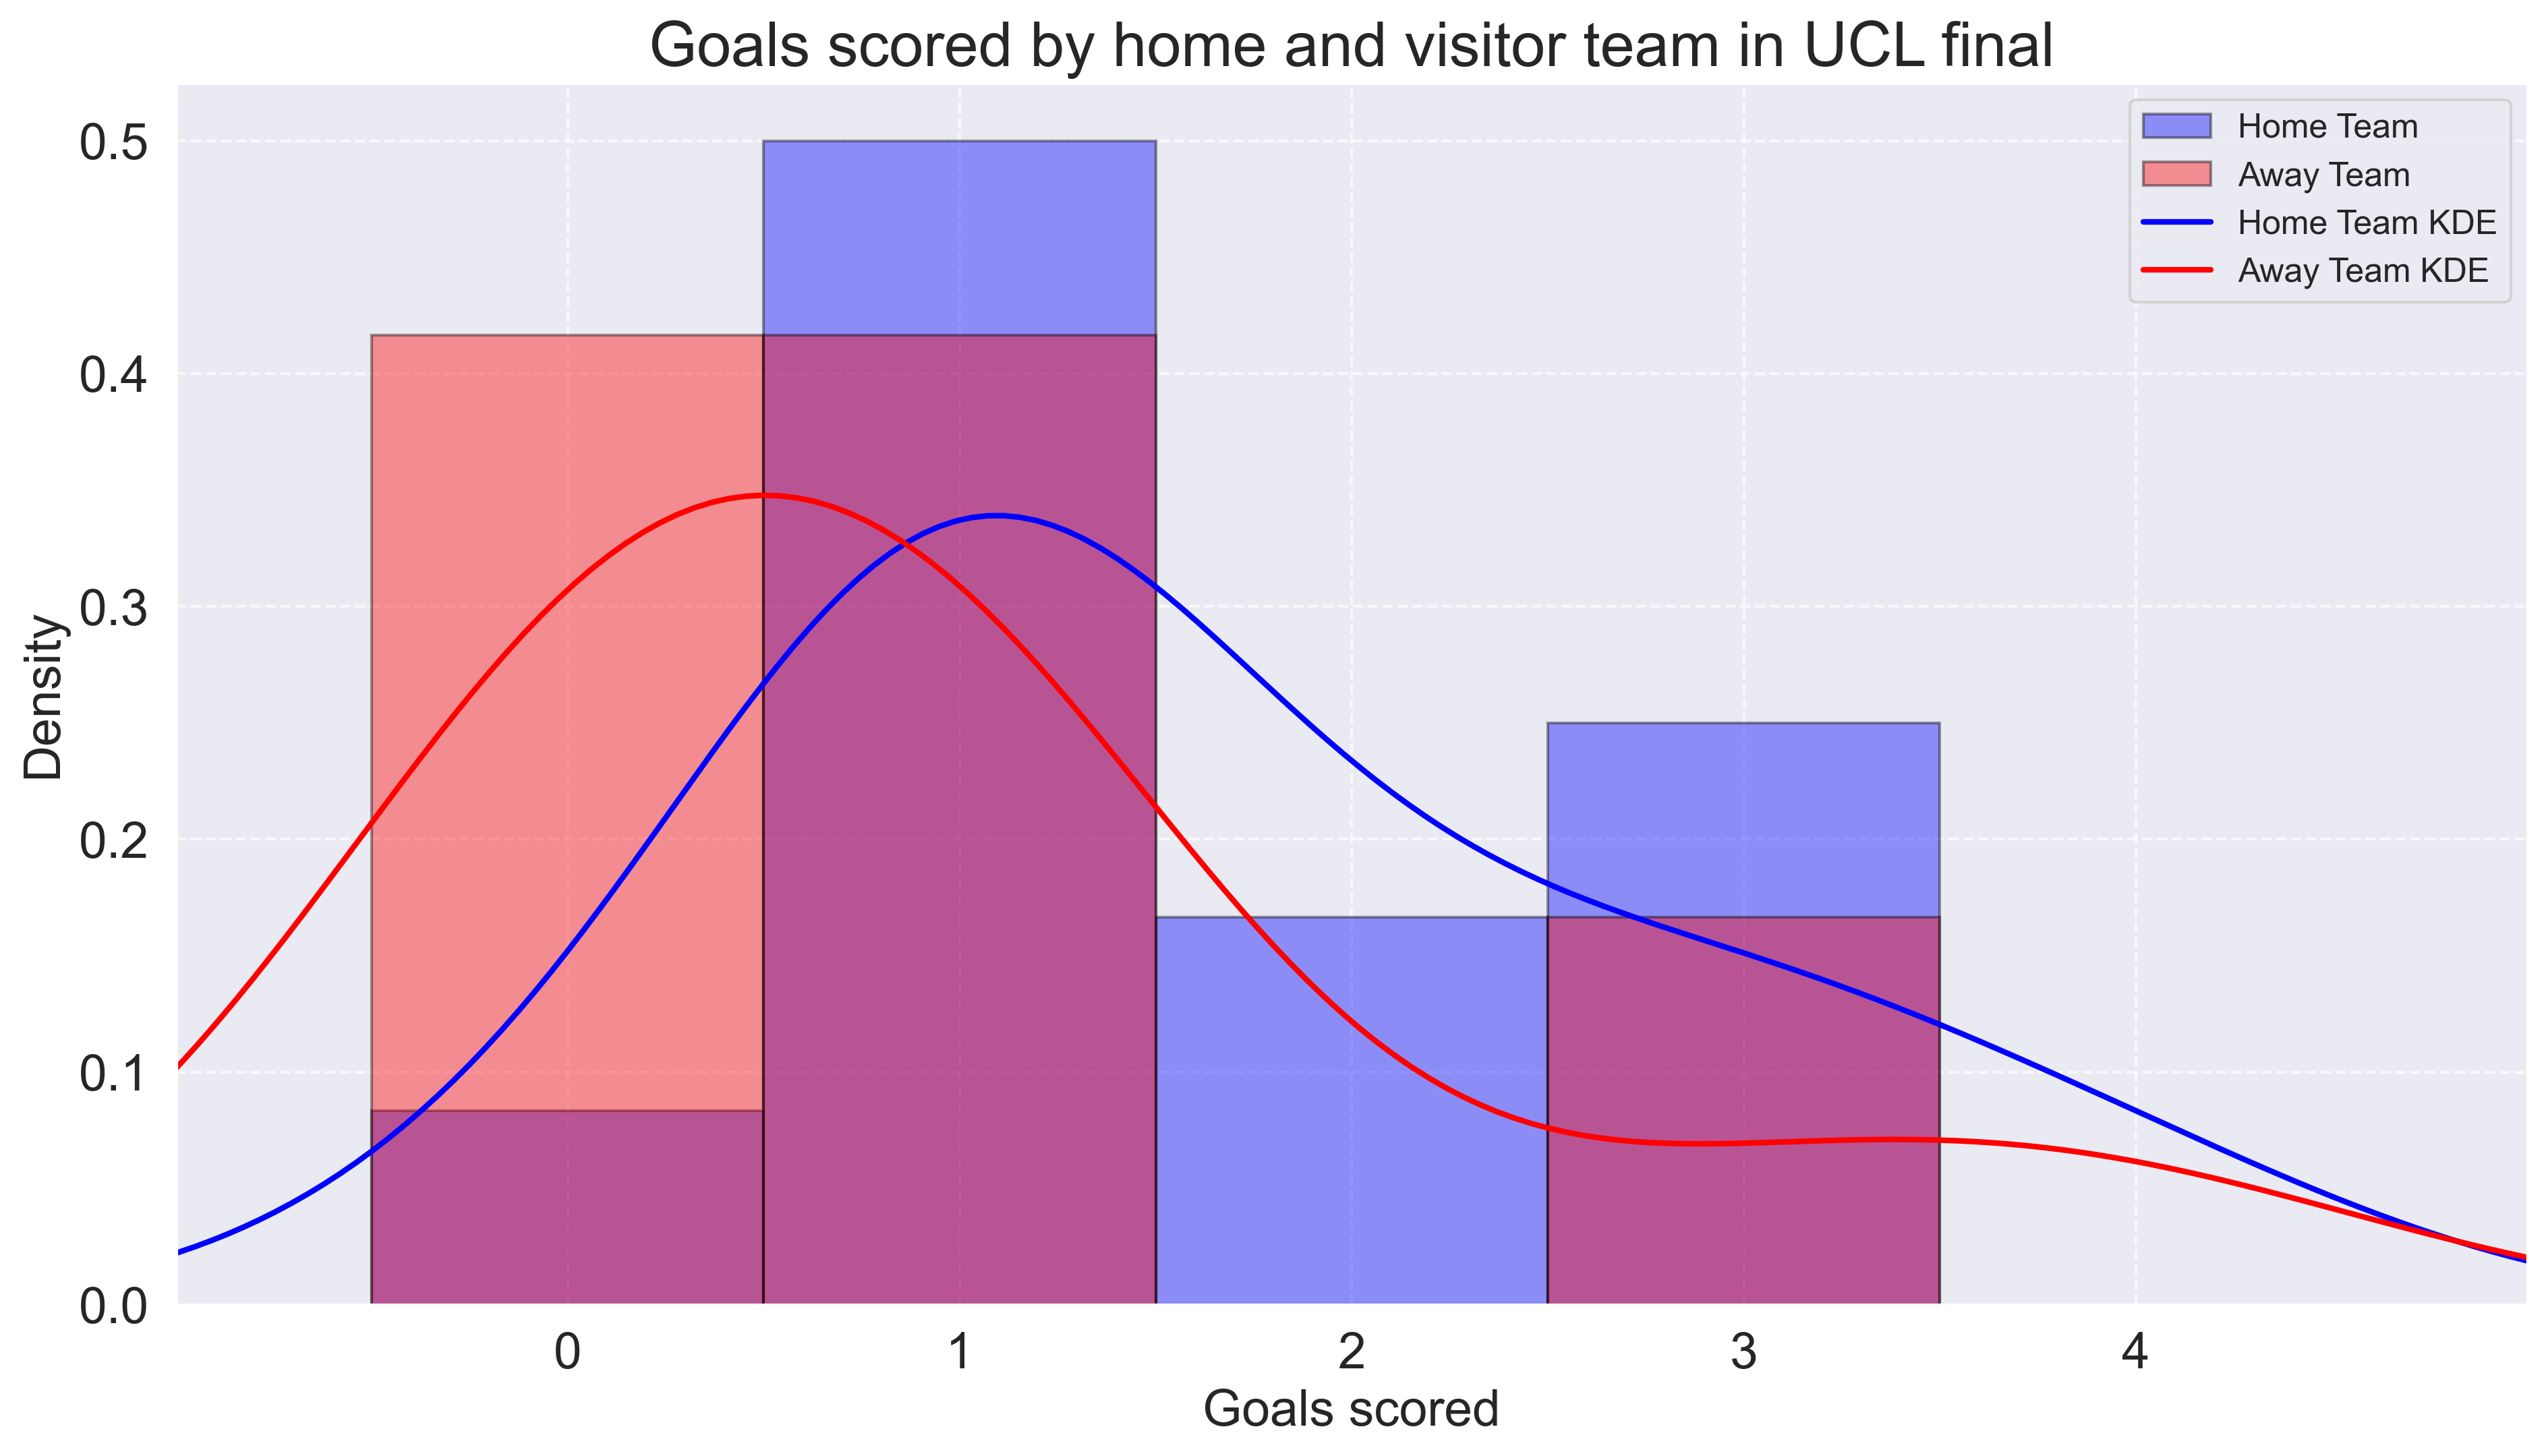
Figure 12: Distribution of the goals scored by home and visitor during UCL final alongside their Kernel Density Estimation (KDE).
We wanted to statistically test the difference between the two distributions using the Mann-Whitney U test. We opted for this non-parametric algorithm because data are not normally distributed (Shapiro-Wilk test returned p<0.05 in both cases) and both sample contain only 12 elements. However, the test yields a p=0.09 thus we cannot reject the null hypothesis with 95% confidence level.
Attendance
We conclude our analysis by examining the attendance at the UCL final over the years as shown in Figure 13.
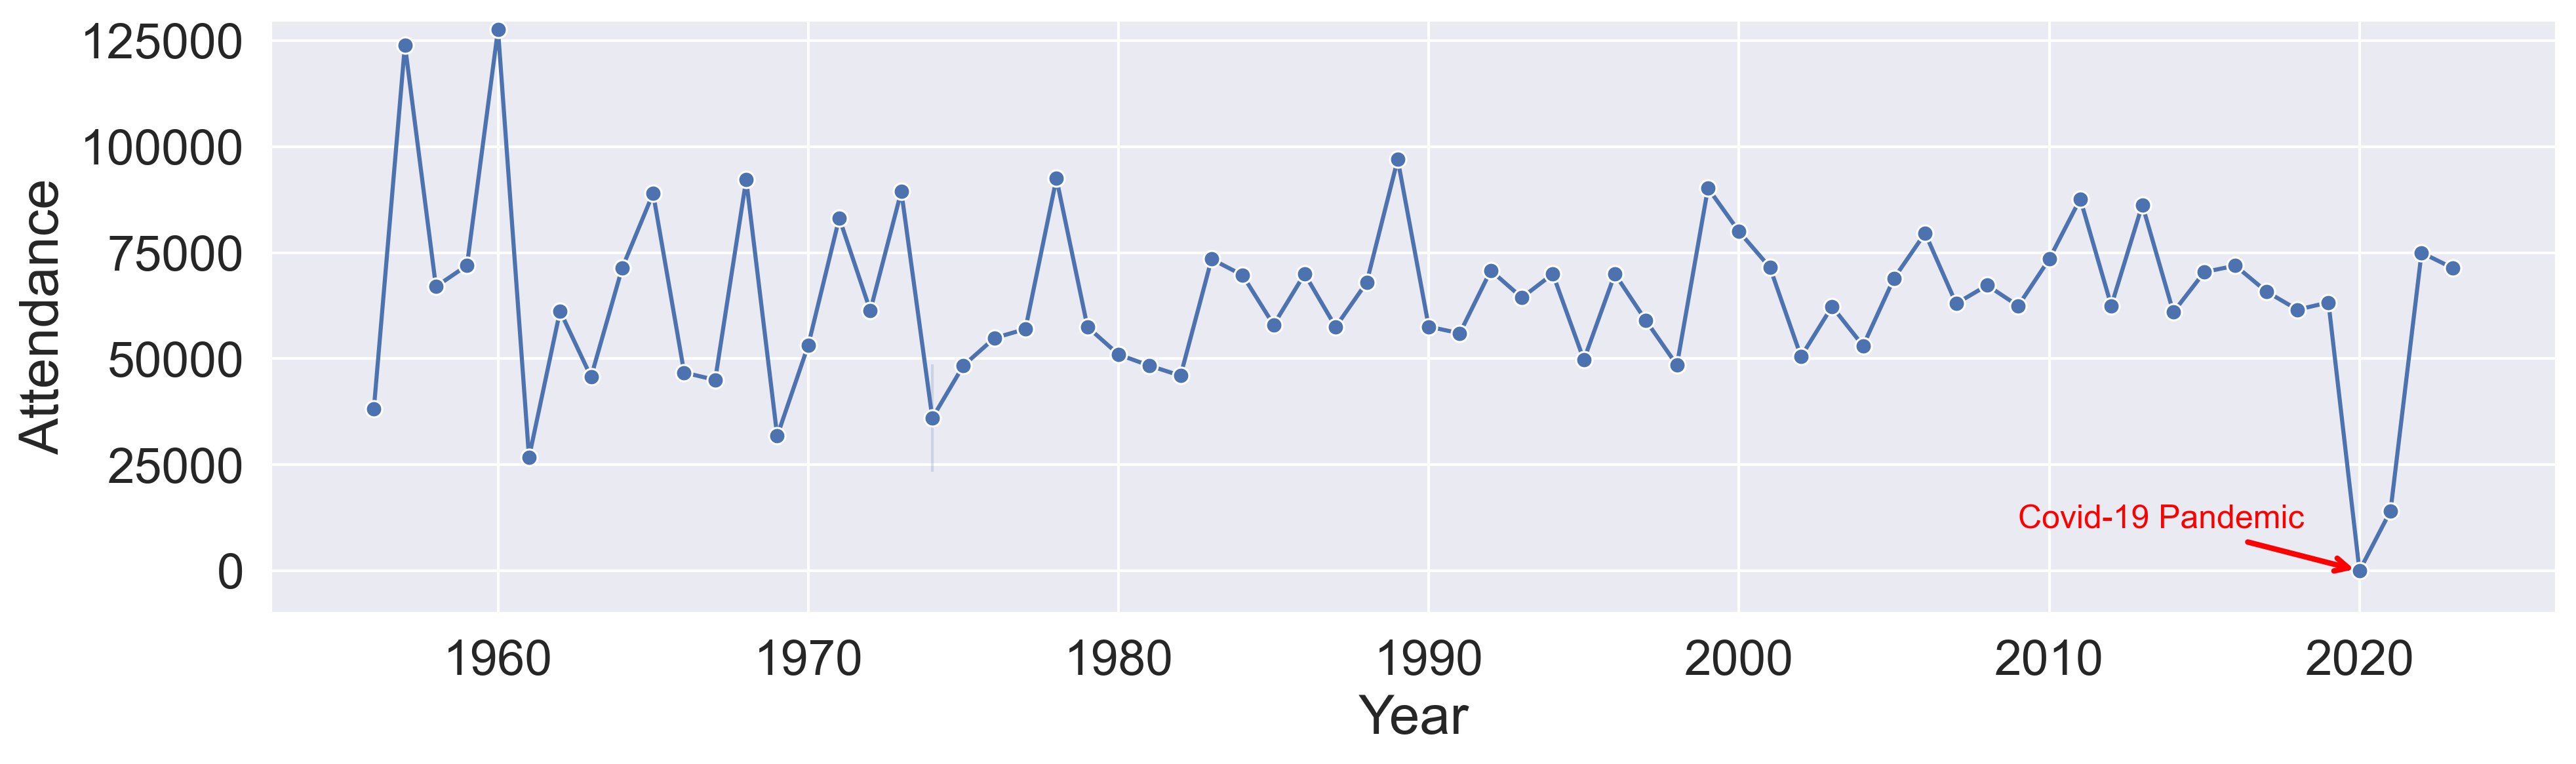
Figure 13: Attendance during UCL final across the years.
The data reveals variations in attendance across different decades, with the highest recorded attendances being 124,000 in 1957 at the Santiago Bernabéu Stadium in Madrid and 127,621 in 1960 at Hampden Park in Glasgow. Both matches were victories for Real Madrid. While the substantial turnout in 1957 was expected due to the final being held at the Santiago Bernabéu, the even larger crowd in 1960 in Scotland underscores the extensive fanbase of Real Madrid. We also highlight the significant drop in attendance during the 2020 final, which saw an attendance of zero due to the COVID-19 pandemic. This unprecedented situation led to the postponement and eventual rescheduling of the match, with the final being played in a restricted environment without fans in attendance. The pandemic’s impact on global sporting events is starkly reflected in this anomaly, underscoring how external factors can drastically affect match-day experiences and attendance figures. The effects of the pandemic were also evident in attendance in 2021, with only 33% of the do Dragao stadium’s capacity open to supporters.
As previously noted in the discussion of the 1957 final, attendance fluctuations are largely influenced by whether one of the teams is playing the final in its home country. The boxplot in Figure 14 illustrates the difference in attendance when one of the two teams has home-country advantage compared to when neither team is playing in their own country.
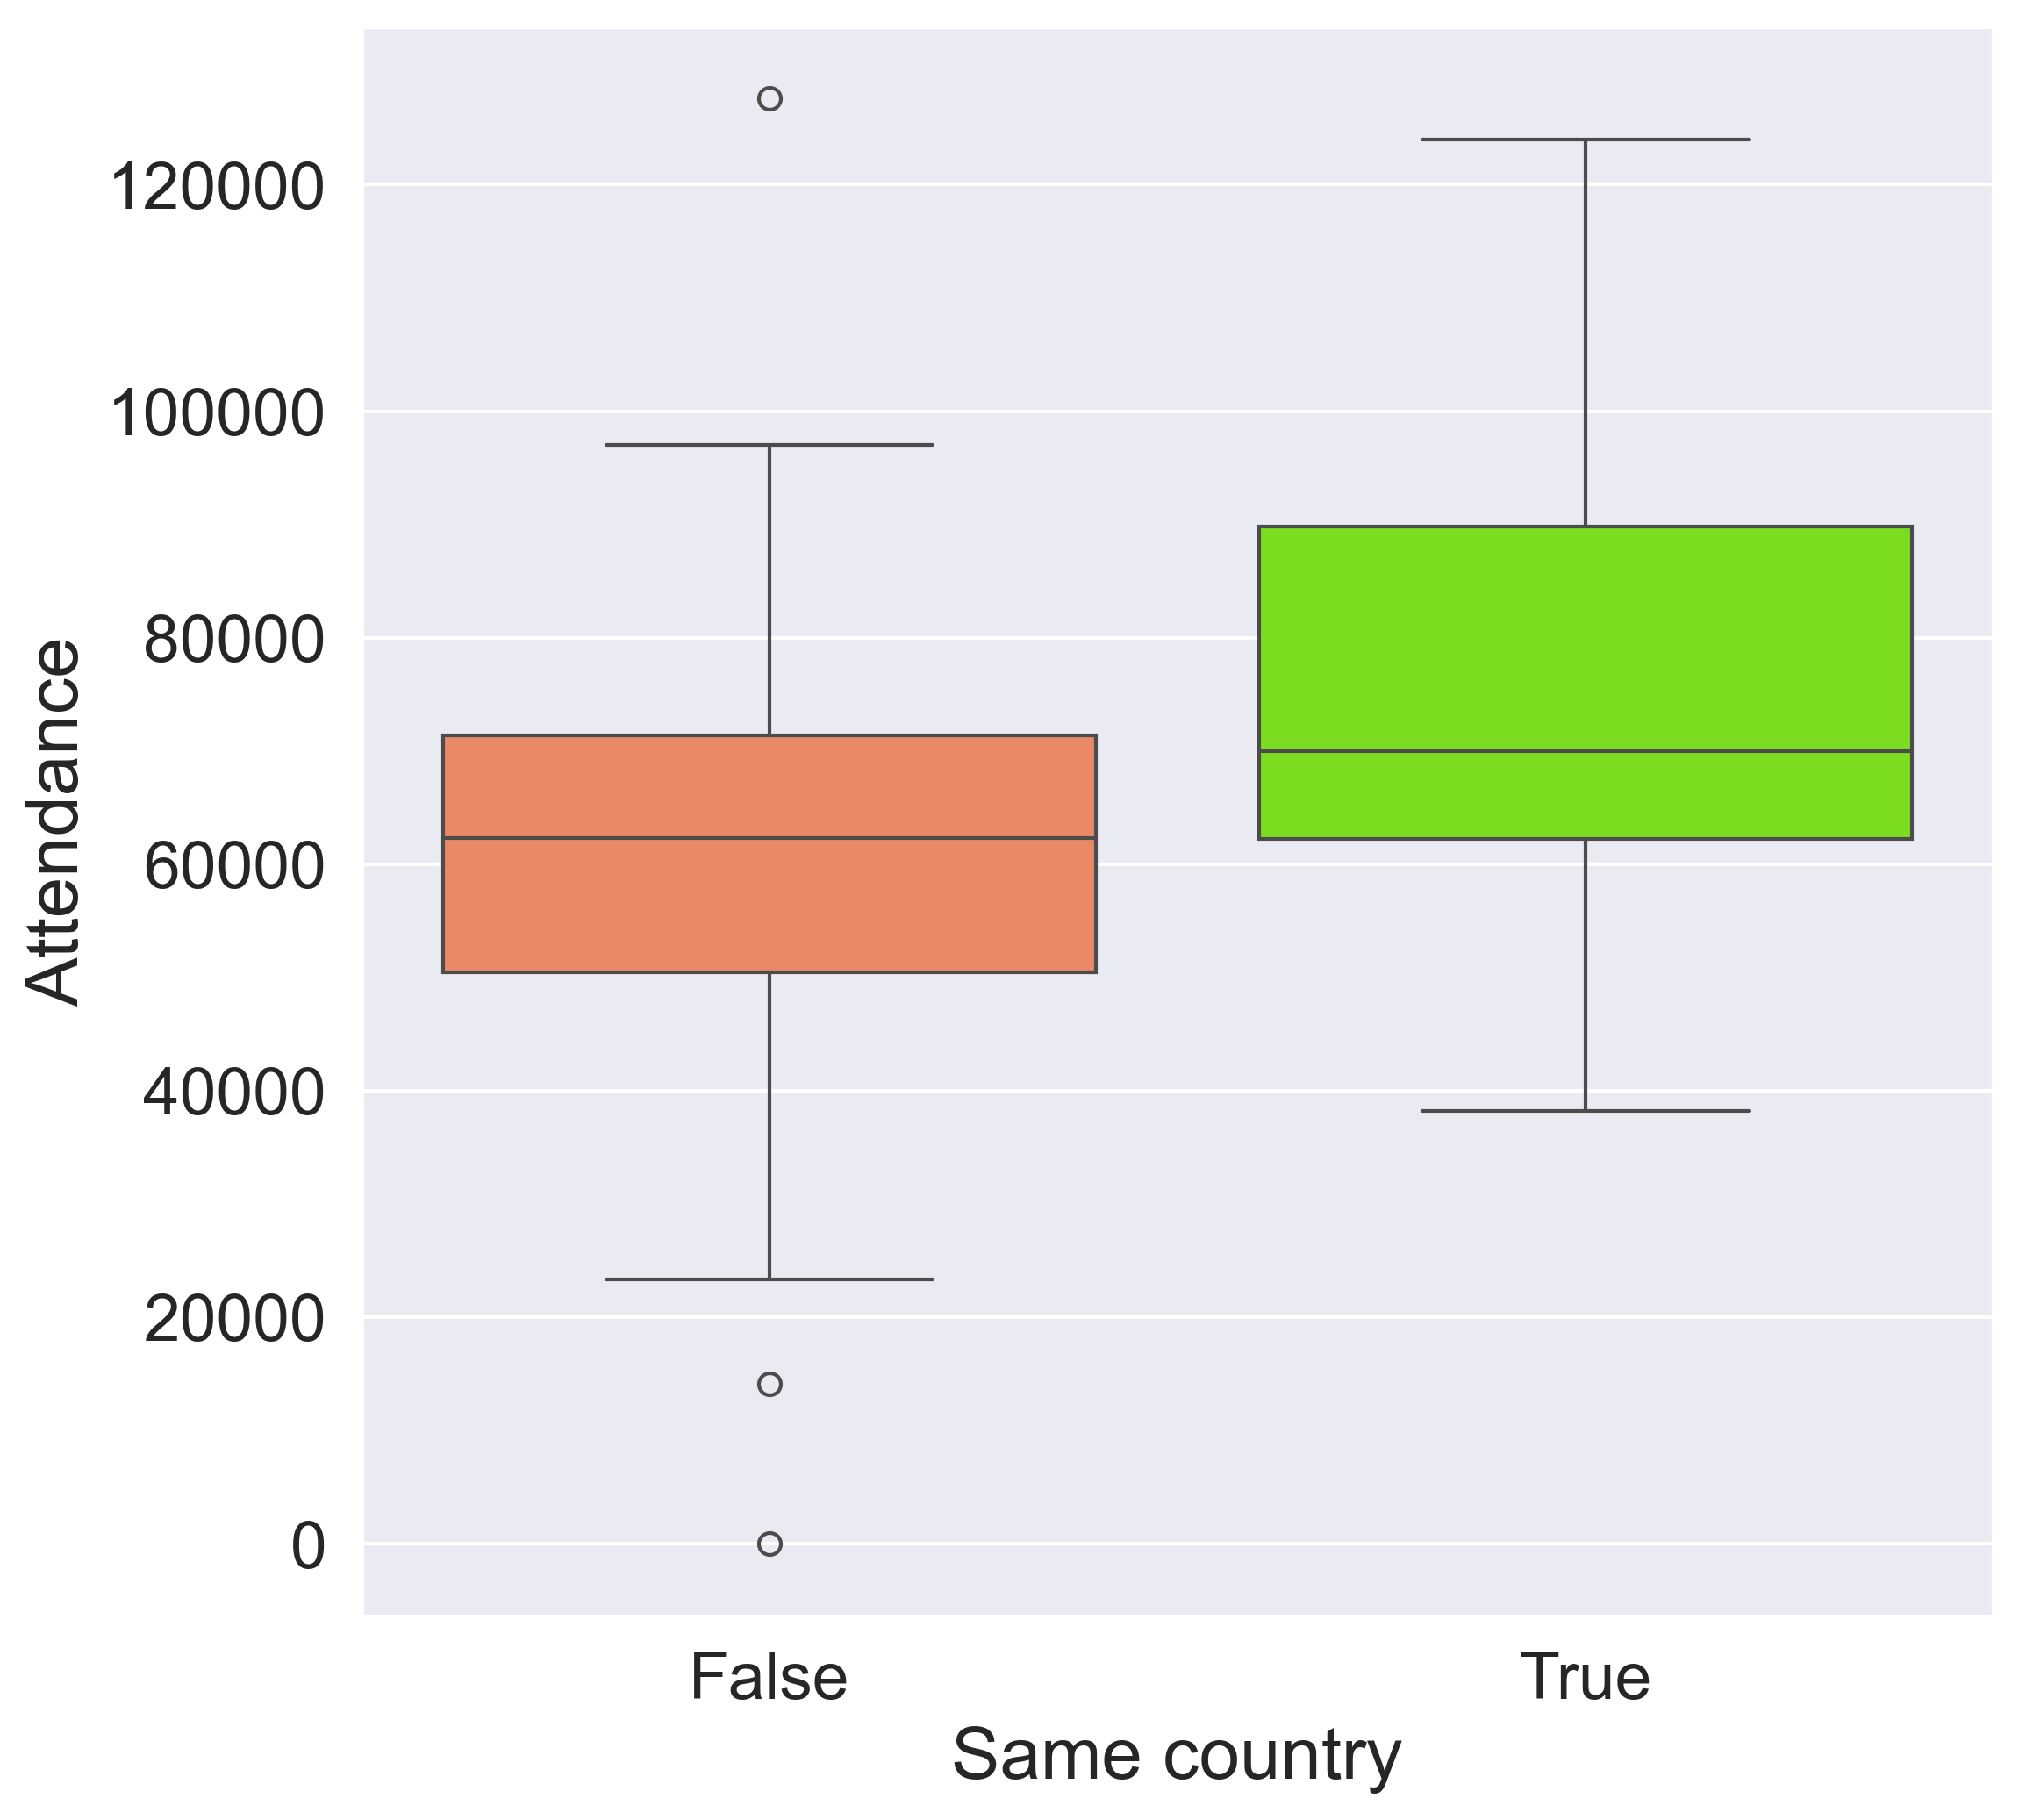
Figure 14: Distribution of attendance during UCL finals if one of the country played in home country (green) or not (red).
There is a clear difference between the two distributions, with the former (goals scored by team playing in their home country) shifted towards larger values on average with respect to the latter. We statistically confirmed this difference by employing the Mann-Whitney U test that allows us to reject the null hypothesis (i.e. the two samples come from the same distribution) with a p<0.05.
Lastly, we examined which country has the highest average attendance. The left panel of Figure 15 highlights the top five countries by average attendance, regardless of how often they have hosted events. Interestingly, Yugoslavia leads the rankings, with an average of nearly 90,000 attendees, primarily due to the 1972-73 season when AFC Ajax defeated Juventus 1-0 in Belgrade. Because Yugoslavia did not host many finals, this one high-attendance event significantly boosts the country’s average. Scotland follows with just under 80,000 attendees, but this finding is heavily influenced by the 1960 final (Real Madrid vs. Eintracht Frankfurt, 7-3), while the other two events barely reached 50,000 attendees.
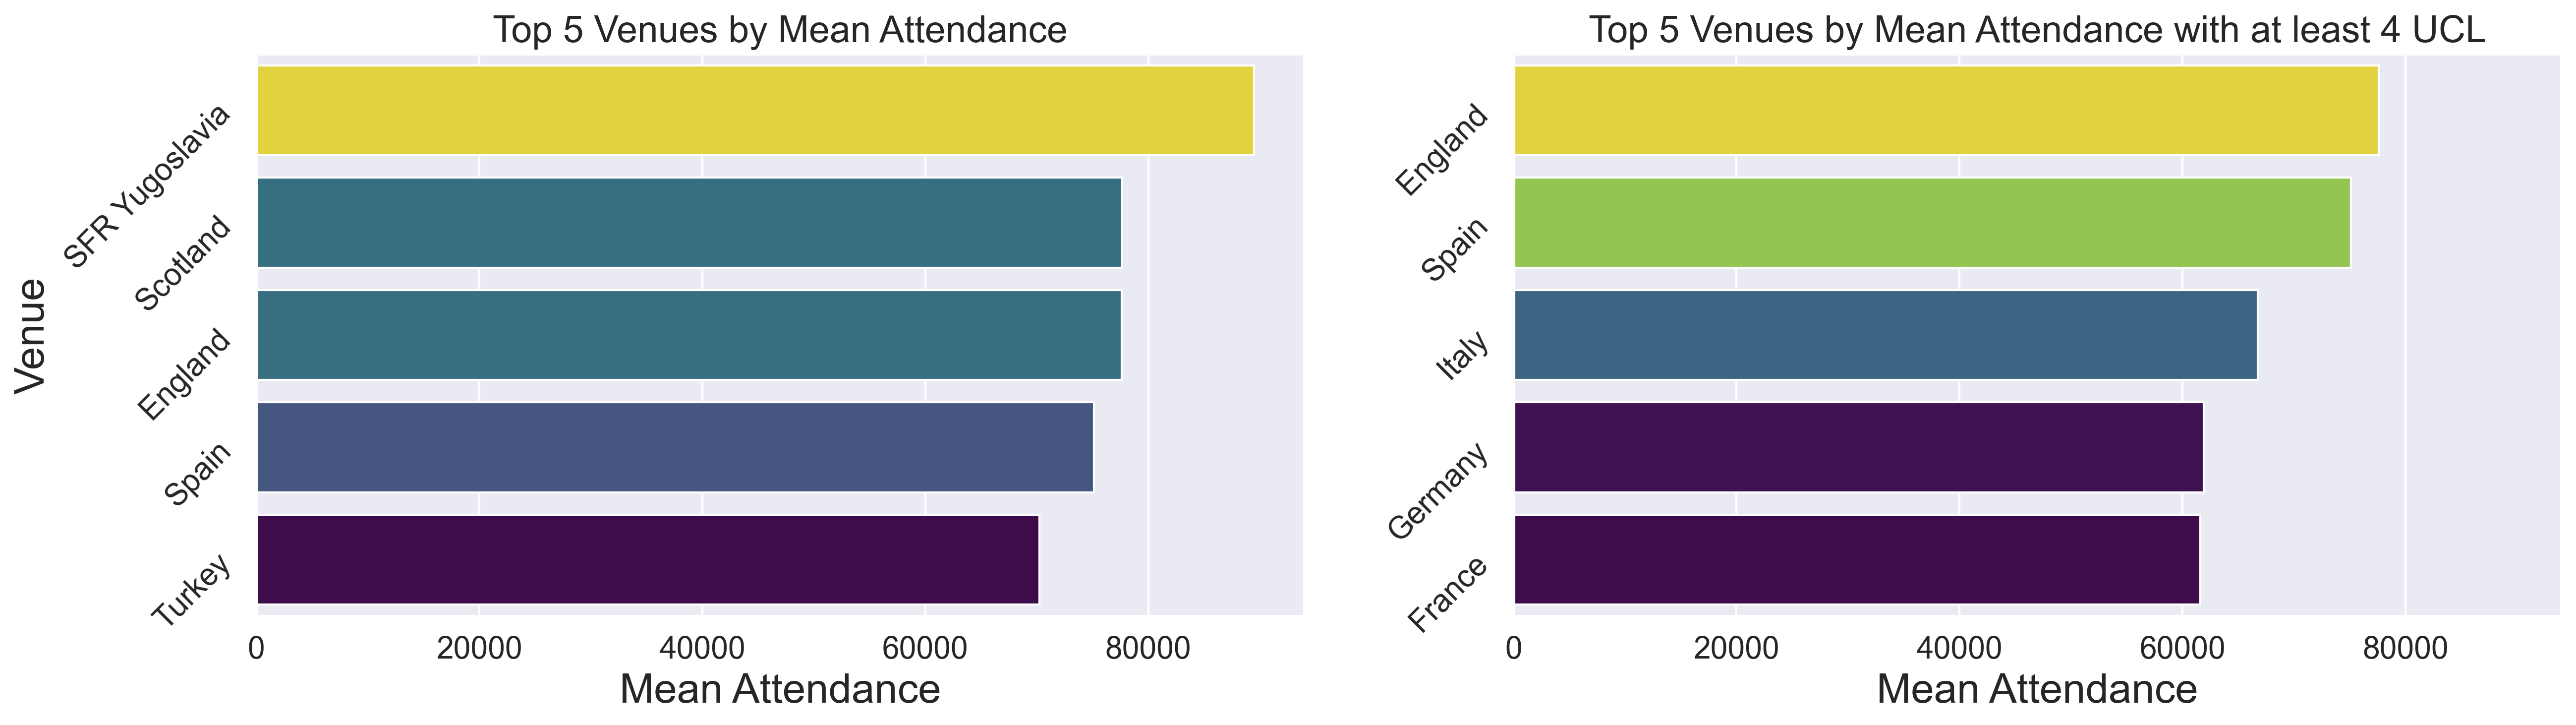
Figure 15: Left panel, top five venues by mean attendance. Right panel, top five venues with at least 4 participation by mean attendance.
Recognizing the limitations of this approach, we also narrowed the analysis to countries that have hosted at least four times (right panel). When the analysis is limited to countries that have hosted at least four times, the results change. Countries like England and Spain, which have hosted multiple finals over the years, show more consistent and high average attendance. This consistency suggests these countries have larger or more frequently used venues, better infrastructure, and possibly a stronger football culture, leading to consistently high turnout. Italy also ranks highly under this refined criterion, indicating a strong and consistent interest in football events.
We conclude our analysis by showing the correlation heatmap between the features of the finals dataset seeking for correlations.
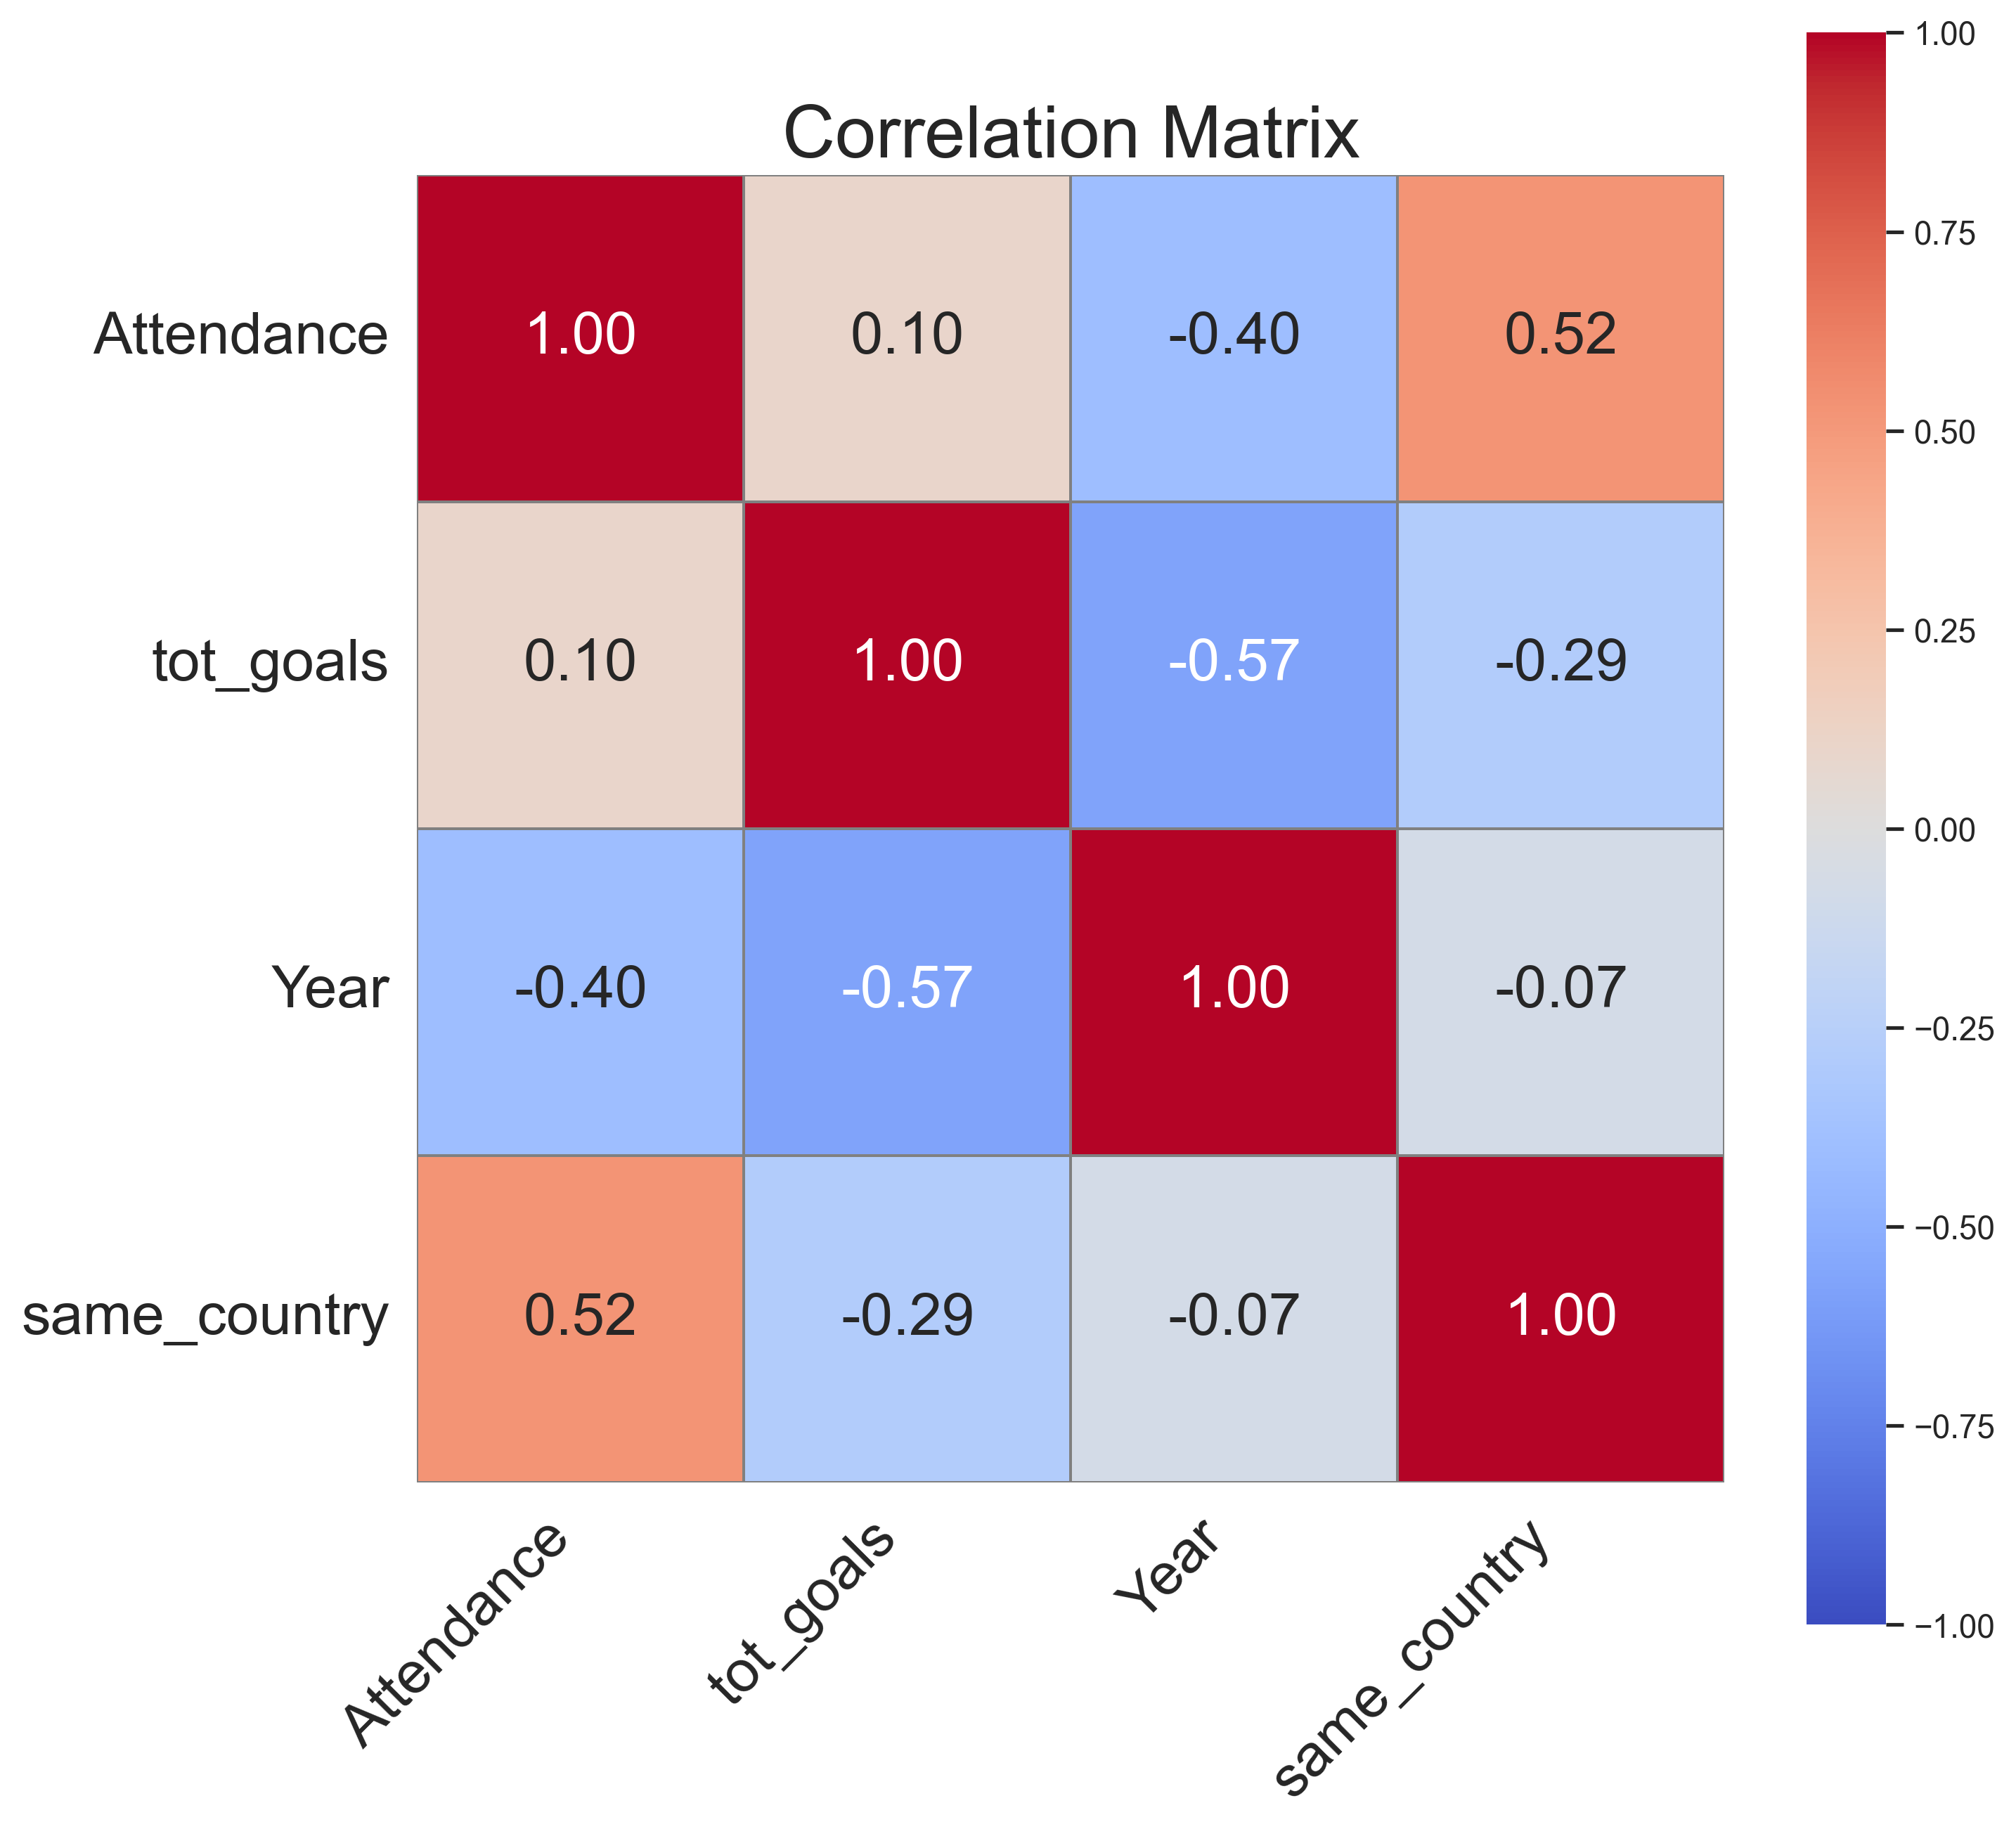
Figure 16: Correlation matrix of the `finals` dataset.
We found no significant relationship, but there is a mildly positive correlation between attendance and instances where one of the finalists is playing in their home country as already discussed before.
Recommendations and Insights
Insights
Dominance and Evolution of European Football: Real Madrid has clearly dominated the UEFA Champions League with the highest number of appearances and victories. However, when considering win/loss ratios, Bayern Munich and FC Barcelona show slightly better efficiency, highlighting that dominance is not solely about the number of wins but also about consistency. We also mention AC Milan, Liverpool FC and FC Barcelona that won 7, 6 and 5 UCL trophies respectively. Teams like Manchester City and Paris Saint-Germain, though not historically prominent in the UCL, have emerged as significant contenders. This indicates a shift in European football dynamics, where financial investment and strategic management are reshaping traditional power structures.
Geographical Disparity in Success: The majority of UCL titles are concentrated in Western Europe, particularly in Spain, England, and Italy, due to factors like financial power, advanced infrastructure, and strong domestic leagues. Eastern and Northern Europe, by contrast, have a minimal presence, reflecting economic and infrastructural challenges.
Importance of Experience: The analysis suggests that experience plays a critical role in UCL success. As teams accumulate more matches, their win probability improves, reflecting the non-linear, likely quadratic, nature of learning and expertise in high-stakes competitions.
Tactical and Goal-Scoring Trends: The analysis of UCL finals indicates a trend towards tightly contested matches, with 1-0 being the most common scoreline. This highlights the high stakes and defensive strategies often employed in these finals. However, goal-scoring trends have fluctuated over the decades, influenced by tactical evolution, physical and technical developments, and the emergence of “super teams.”
Home Advantage in Finals: Teams playing the final in their home country have a noticeable advantage, winning 58.3% of the time. The familiarity with the venue and the psychological boost from home support likely contribute to this trend, as reflected in both win rates and goal distributions.
Attendance Patterns and Influences: Attendance at UCL finals has varied significantly over the years, influenced by factors such as the participation of local teams, venue capacity, and external events like the COVID-19 pandemic. Countries with strong football cultures and infrastructure, like England and Spain, consistently attract large crowds, underscoring the importance of venue and host country in the fan experience.
Recommendations
Strategic Investment in Emerging Clubs: Clubs should prioritize gaining experience in international competitions, as it is a key factor in improving win probabilities. Youth development programs and strategic participation in European leagues could help newer clubs build the necessary expertise.
Balanced Tactical Approach in Finals: Given the prevalence of low-scoring finals, teams might consider adopting balanced tactics that focus on solid defense while being prepared to capitalize on counter-attacks. Understanding historical scoring trends can guide tactical decisions in high-pressure matches.
Leveraging Home Advantage: When hosting UCL finals, clubs and national football associations should capitalize on the home advantage by optimizing preparations, fan engagement, and leveraging local familiarity to boost team performance.
Enhancing Fan Experience and Attendance: For countries hosting UCL finals, investing in infrastructure and creating an engaging fan experience can lead to higher attendance and global visibility. This is particularly important for countries aiming to boost their football culture and attract more international events.
Addressing Geographical Disparities: UEFA and national football associations could consider initiatives to bridge the gap between Western and Eastern/Northern Europe in terms of football development. This could include financial support, infrastructure development, and exchange programs to elevate the competitive standard across the continent.
Limitations
finals.csvdataset does not take into account further information about the final match (e.g. weather conditions, red/yellow cards, possession stats) that might have played a role in the final outcome;
References
This ends my Exploratory Data Analysis project of UEFA Champions League 1953-2023. The full Python code is available on my GitHub repository.
If you have any questions please feel free to reach me out at 📧 chrismagliano.cm@gmail.com or christian.magliano@unina.it