
Exploratory Data Analysis of Most Streamed Spotify songs
![]()
Table of Contents
- Project Overview
- Data Sources & tools
- Data Cleaning & Preparation
- Exploratory Data Analysis
- Results and Findings
- Recommendations and Insights
- Limitations
- References
Project Overview
Spotify is a popular music streaming service that offers a vast library of songs, podcasts, and other audio content. Launched in 2008, Spotify allows users to listen to millions of tracks from various artists across the globe. Users can create and share playlists, discover new music through personalized recommendations, and access curated playlists for different moods and genres. Spotify offers both free and premium subscription options, with the latter providing benefits such as ad-free listening, offline downloads, and higher sound quality. It is accessible on multiple devices, including smartphones, tablets, and computers, making it a versatile platform for music and audio entertainment.
Data Sources and tools
In this project I have performed a complete Data Exploration of the most streamed Spotify songs up to 2024. The dataset used in this project was retrieved on Kaggle. It contains 4600 different tracks and a total of 30 columns that provide with important information per each track, e.g. the release date, the artist, the track score, number of streams etc. Thus, the sample does not contain all the tracks on Spotify but just the most streamed ones. This means that there is a threshold value for the Spotify Streams, that turned out to be 1071. Thus we are considering all Spotify track with more than 1071 streams.
Data Cleaning and Preparation
After cleaning the dataset from duplicated values, useless columns (for the scope of my project) and fill the left NaN values with the median value, I was left with 4598 tracks and 22 columns. We opted to use the median because it is more robust against the outliers. However, this always constitutes an approximation of the genuine dataset. For any detailes about data pre-processing check the full code on my GitHub repository!
Exploratory Data Analysis
Exploratory Data Analysis (EDA) process consists of exploring the dataset to answer key questions, such as:
- How has the number of released tracks changed over the years?
- Does a preferred release month exist?
- What are the most streamed songs and artists on Spotify? What about YouTube and TikTok?
- Do explicit songs have higher track score with respect to friendly ones?
- What are the main factors that affect the track score ?
Results and Findings
Firstly, I investigated how the number of released songs has changed over the years till 2023 since at the moment of analysis 2024 is not finished yet.
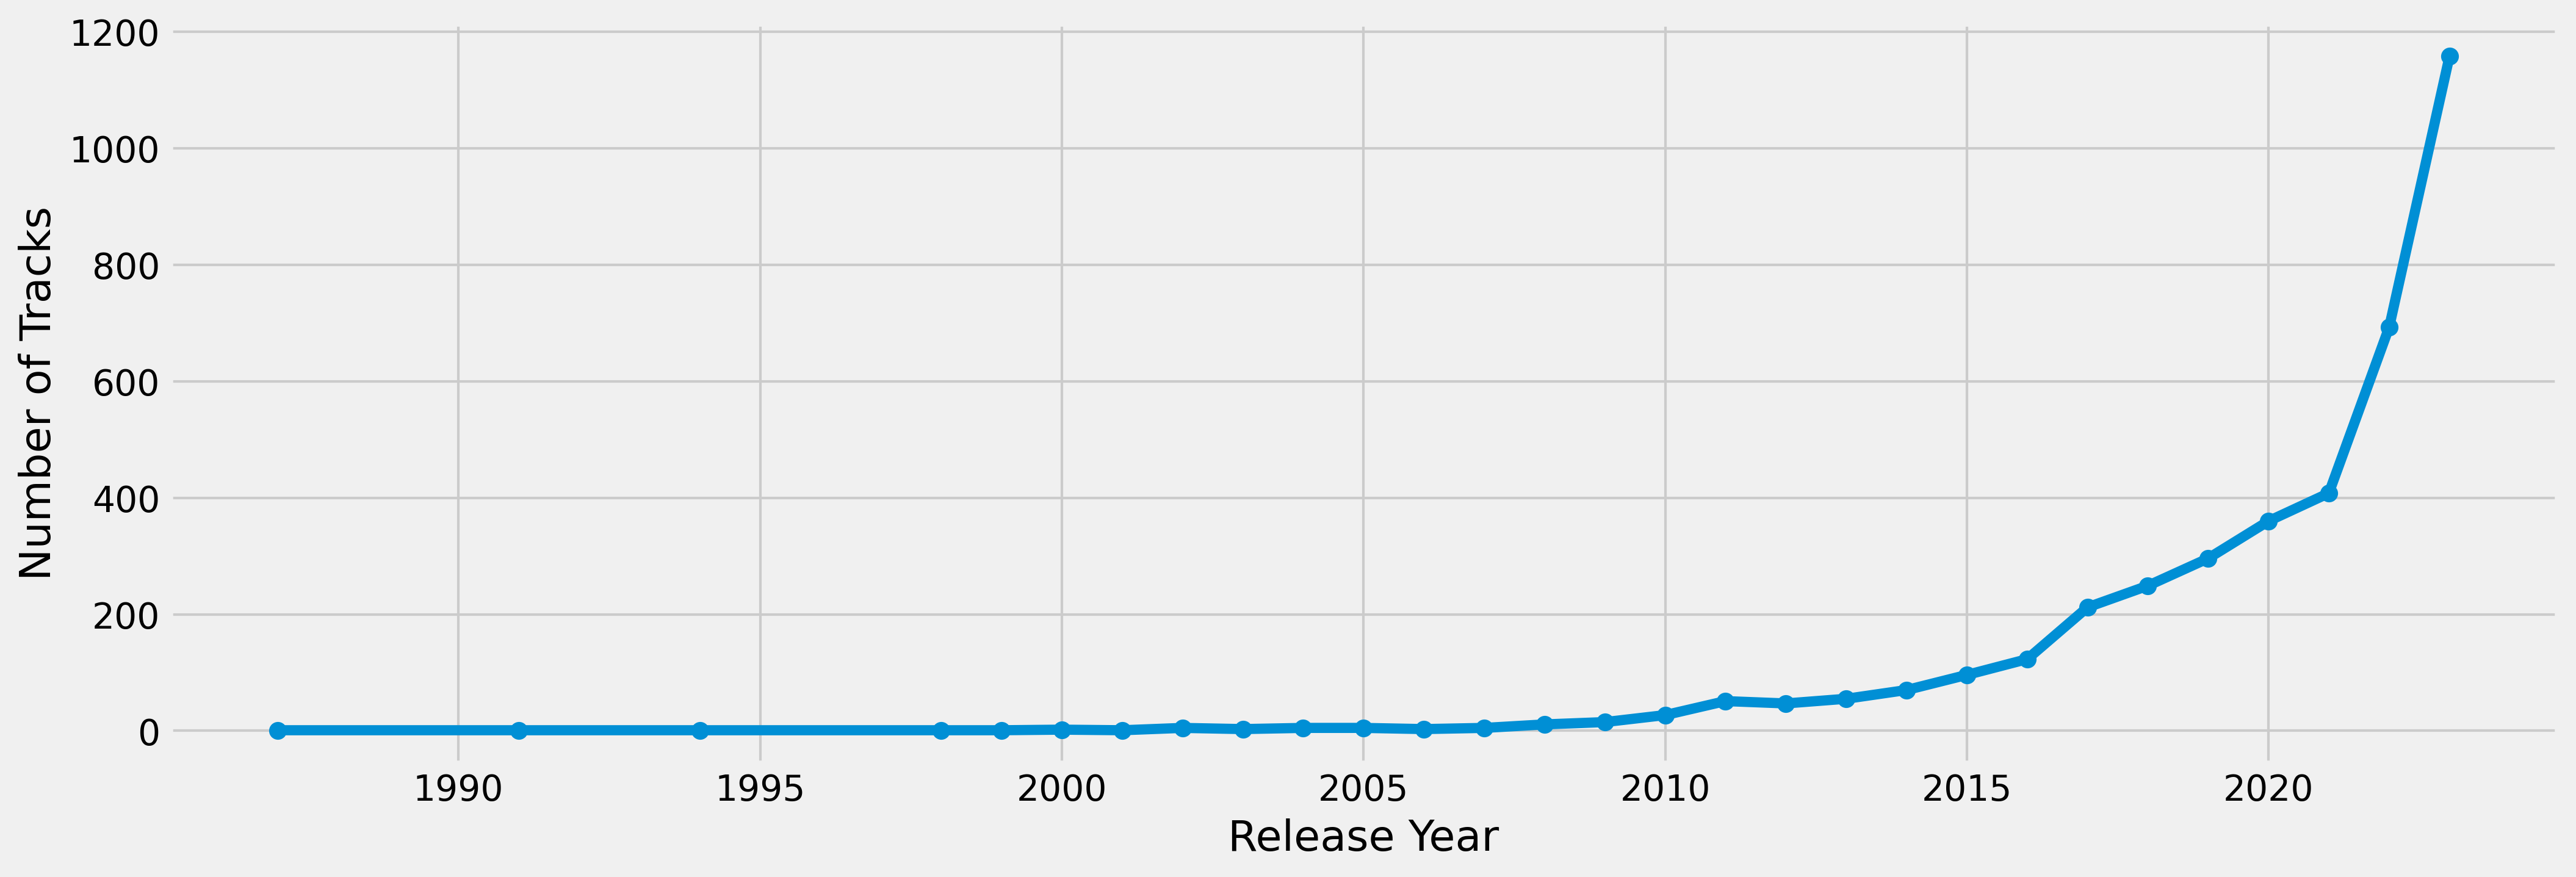
Figure 1: Number of released tracks as a function of the year till 2023.
Figure 1 shows an exponential growth of the number of songs released from 2015. Moreover, while during 2015-2020 nearly 50 songs per year were released, in the last three years 2021-2023, the release rate nearly reaches 400 songs per year. The growing number of released songs each year can be attributed to several factors. The rise of digital platforms and streaming services has made it easier for artists to distribute their music globally without the need for traditional record labels. Advances in technology have lowered the cost and complexity of music production, allowing more independent artists to create and release their work. Additionally, the increasing demand for diverse and niche music genres has encouraged more frequent releases to satisfy varied audience preferences.
Then, I checked if there was a preferred month when artists decide to release their new albums.
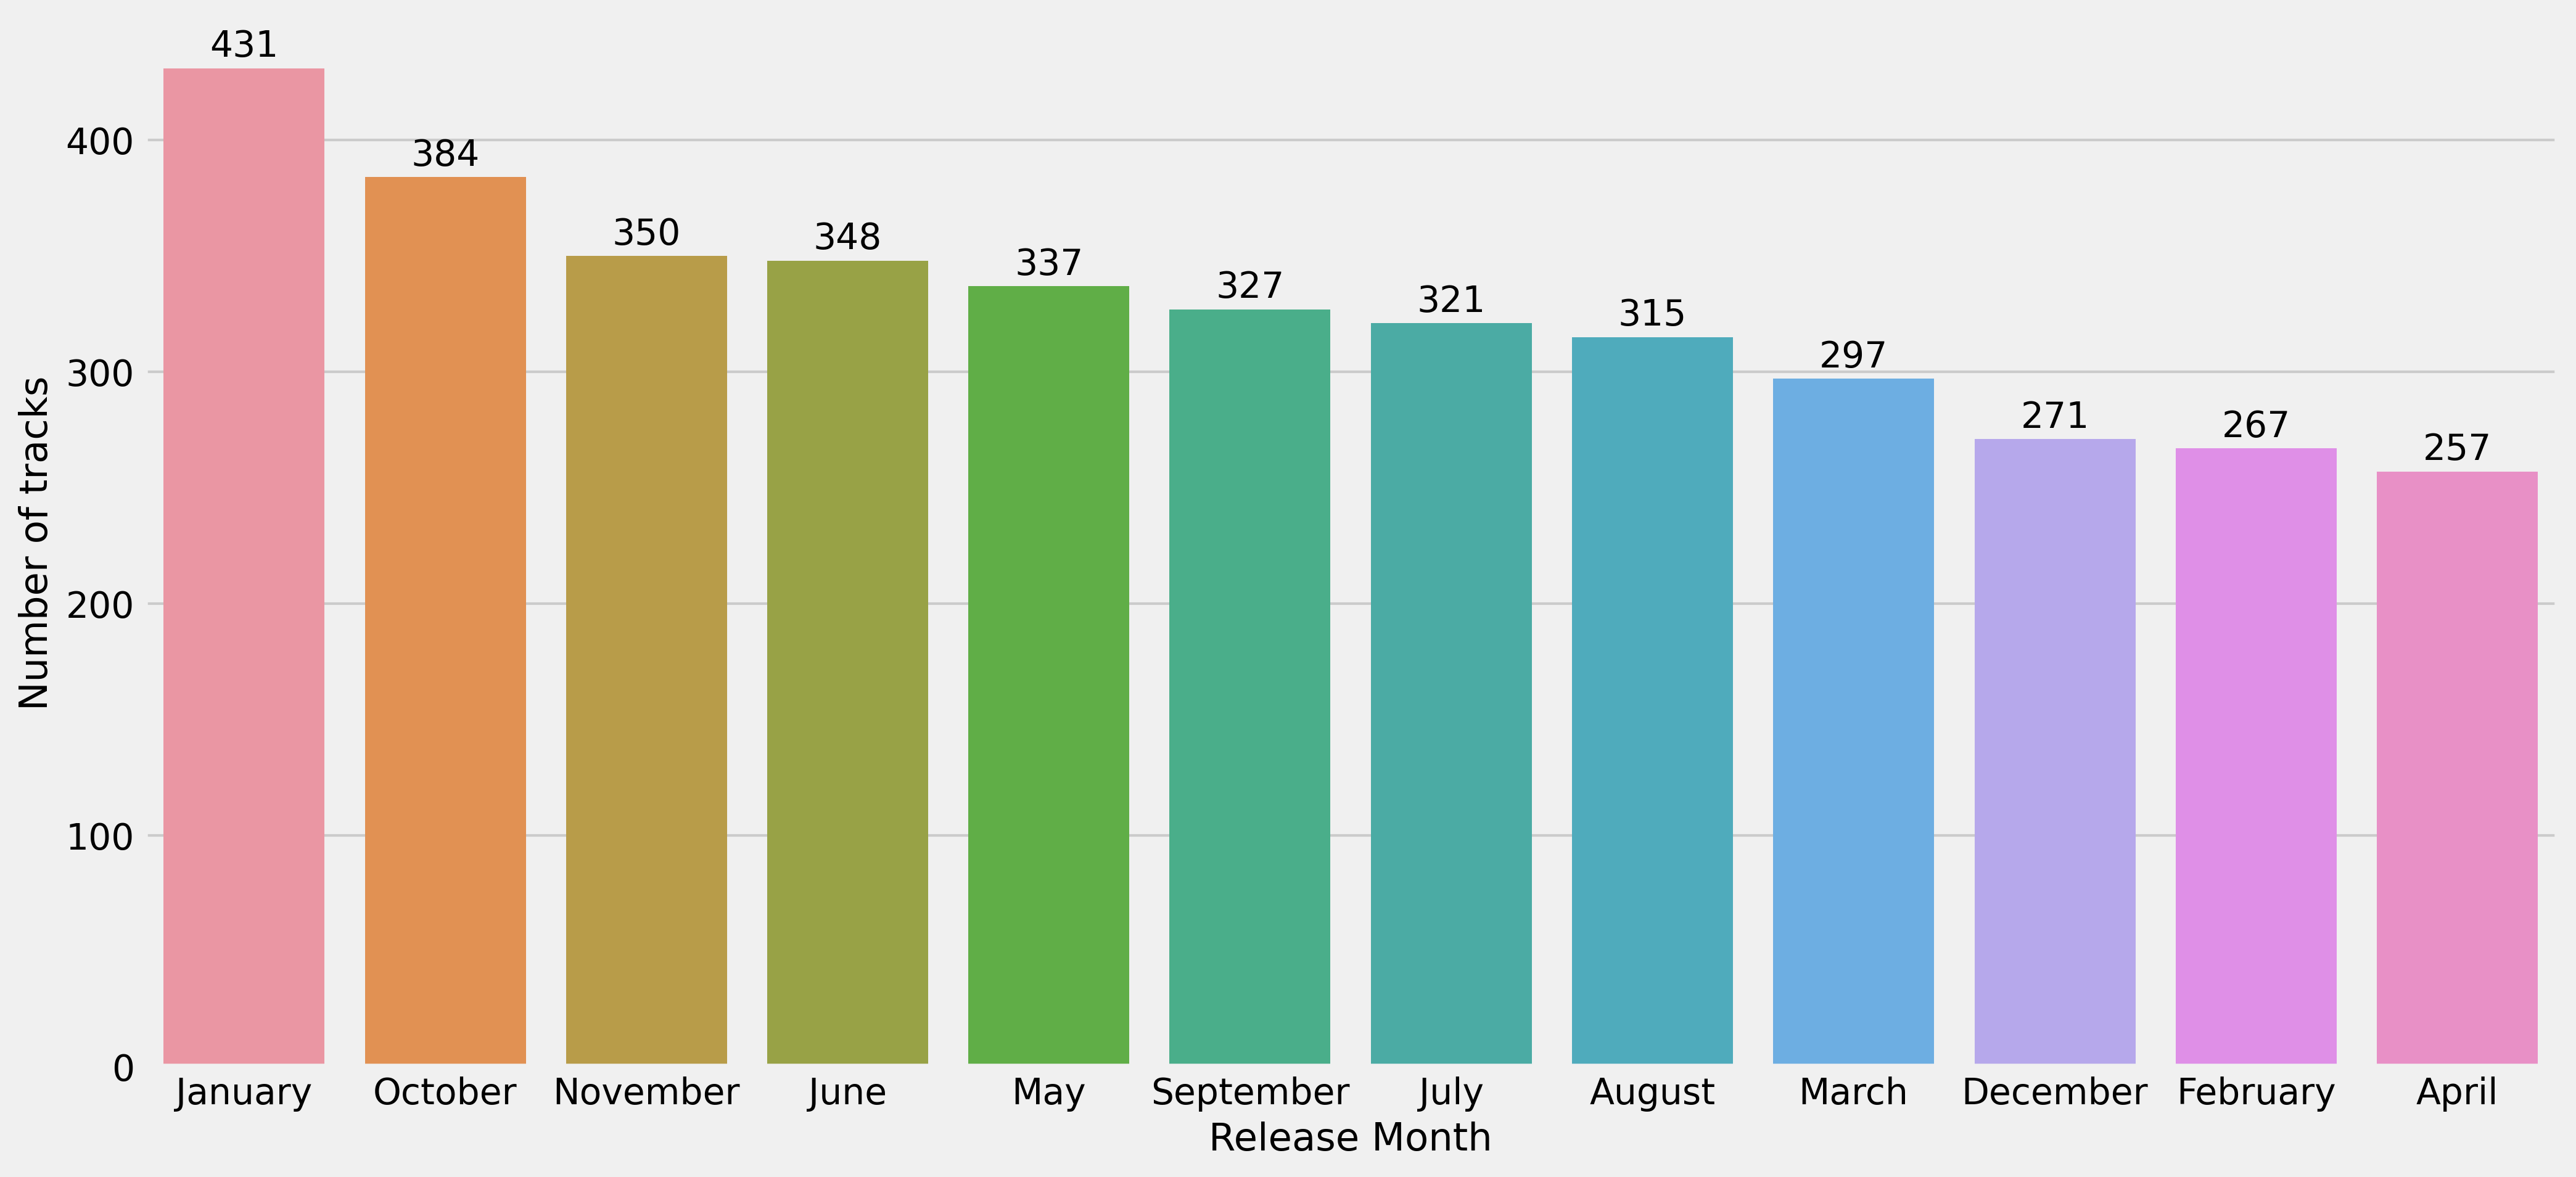
Figure 2: Number of released tracks per months till 2023.
Figure 2 shows the number of tracks per months till 2023. Figure 2 evidences that January is the preferred release month by the artists with 431 songs (9.3% from total), followed by October with 384 songs (8.3% from total). On the contrary, April turns out to be the least preferred with 257 tracks (5.5% from total) alongside with February with 267 tracks (5.8%).
- January follows the holiday season, a period when fewer new releases are scheduled due to the focus on holiday music and end-of-year festivities. Being the first month of the year, people and media are looking for innovation. Thus, January becomes a strategic time to release new material when competition is lower, and audiences are looking for new content.
- October is strategically important for releasing new music ahead of the holiday season. This timing allows albums and singles to gain traction and popularity in time for holiday gift-giving.
- After the flurry of releases in November and December, followed by the New Year releases in January, February can experience a lull as the industry catches its breath. Moreover, with fewer days in February, there might be a slight impact on the number of releases simply due to the shorter timeframe.
- April might be seen as a transitional period, with some artists and labels holding off releases until late spring or early summer when people are preparing for summer activities and vacations.
I here stress that these are only possible explanations of the found results. However the music industry often follows specific marketing cycles, and these cycles can influence the timing of releases. In some markets, the eligibility periods for music awards can influence release dates. Artists might align their release schedules with touring and festival seasons. Certain months are influenced by cultural events and holidays, which can either encourage or discourage new releases. All these factors contribute to prevent the consolidation of a dominant release month over the others. In fact, despite January being the top month for song releases, its percentage difference with respect to April (the worst month) corresponds to only 3.8%.
Successively, I examined which are the most streamed songs and artists on the three major platforms (Spotify, YouTube and TikTok) and reported in Figure 3 and 4 respectively.
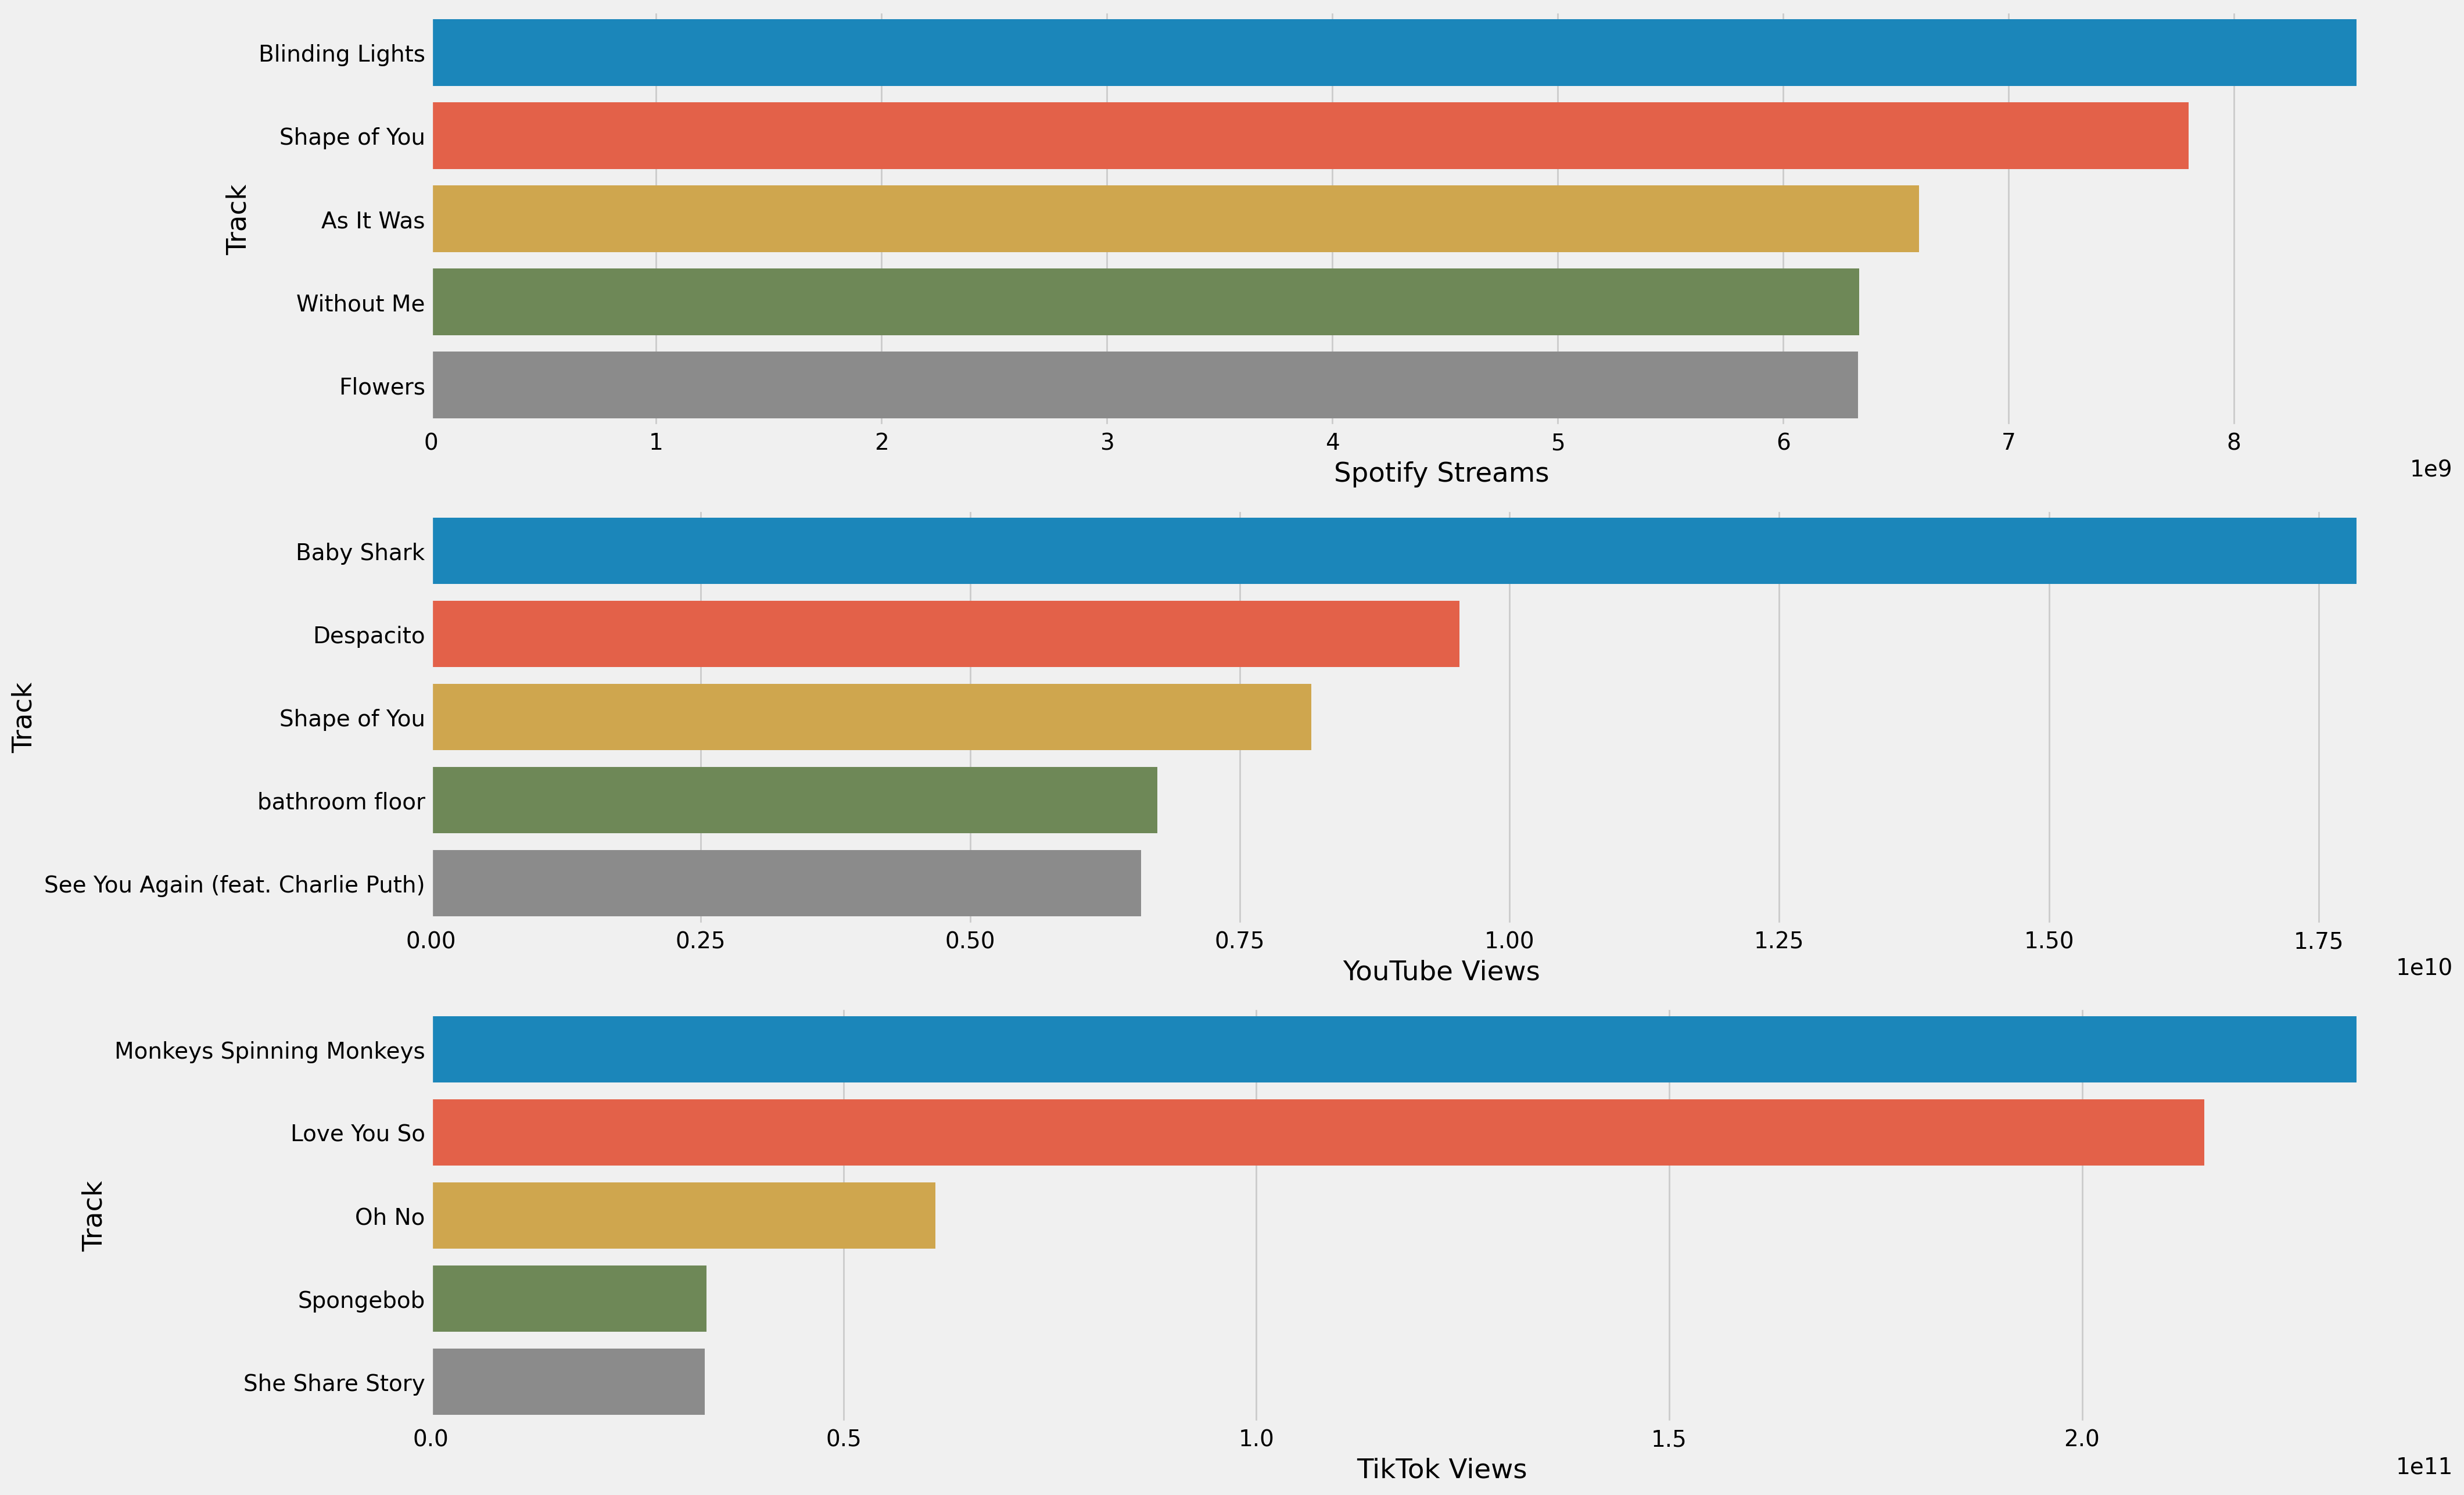
Figure 3: Most streamed tracks on Spotify (upper panel), YouTube (middle panel) and TikTok (bottom panel).
Blinding Lights (The Weekend) is the most streamed song on Spotify with more than 8 billions streams, immediately followed by Shape of You (Ed Sheeran) with little less than 8 billions streams. Baby Shark, instead, results to be the most streamed on YouTube with more than 17 billions of views, almost doubling Despacito (Luis Fonsi) at the second position with nearly 9 billions of views. We also notice that the third position is occupied by Shape of You that reaches almost 8 billions visualizations. The most streamed song on TikTok, and the most streamed overall, is Monkeys Spinning Monkeys (Kevin MacLeod) which has achieved more than 250 billions of streams! This result indicates that TikTok is nowadays the most used platform to stream video and songs. It is important to highlight that Monkeys Spinning Monkeys is a soundtrack which fits very well with the most viral videos on TikTok. In fact it has only a few millions views on YouTube and nearly 10 millions streams on Spotify (ten thousands times less than TikTok streams!). A similar argument could be made for Love You So (The King Khan & BBQ Show) that outperformed TikTok ranks with more than 200 billions of streams but a few ten millions on the other two platforms.
The most streamed artist on Spotify is Bad Bunny together with The Weeknd with more than 35 billions ratings. Immediately after there is Drake with more than 30 billions streams. Regarding YouTube, the most rated artist is Ed Sheeran with more than 25 billions of listenings, followed by Bad Bunny. Taylor Swift, instead, is the third most streamed artits on YouTube reaching 20 billions plays. As already discussed for the track, also the most streamed artists on TikTok are not the most popular on the other two platforms. In fact, Kevin MacLeod and The King Khan & BBQ Show occupy the first and the second rank in this ranking thanks to their extremely viral soundtracks.
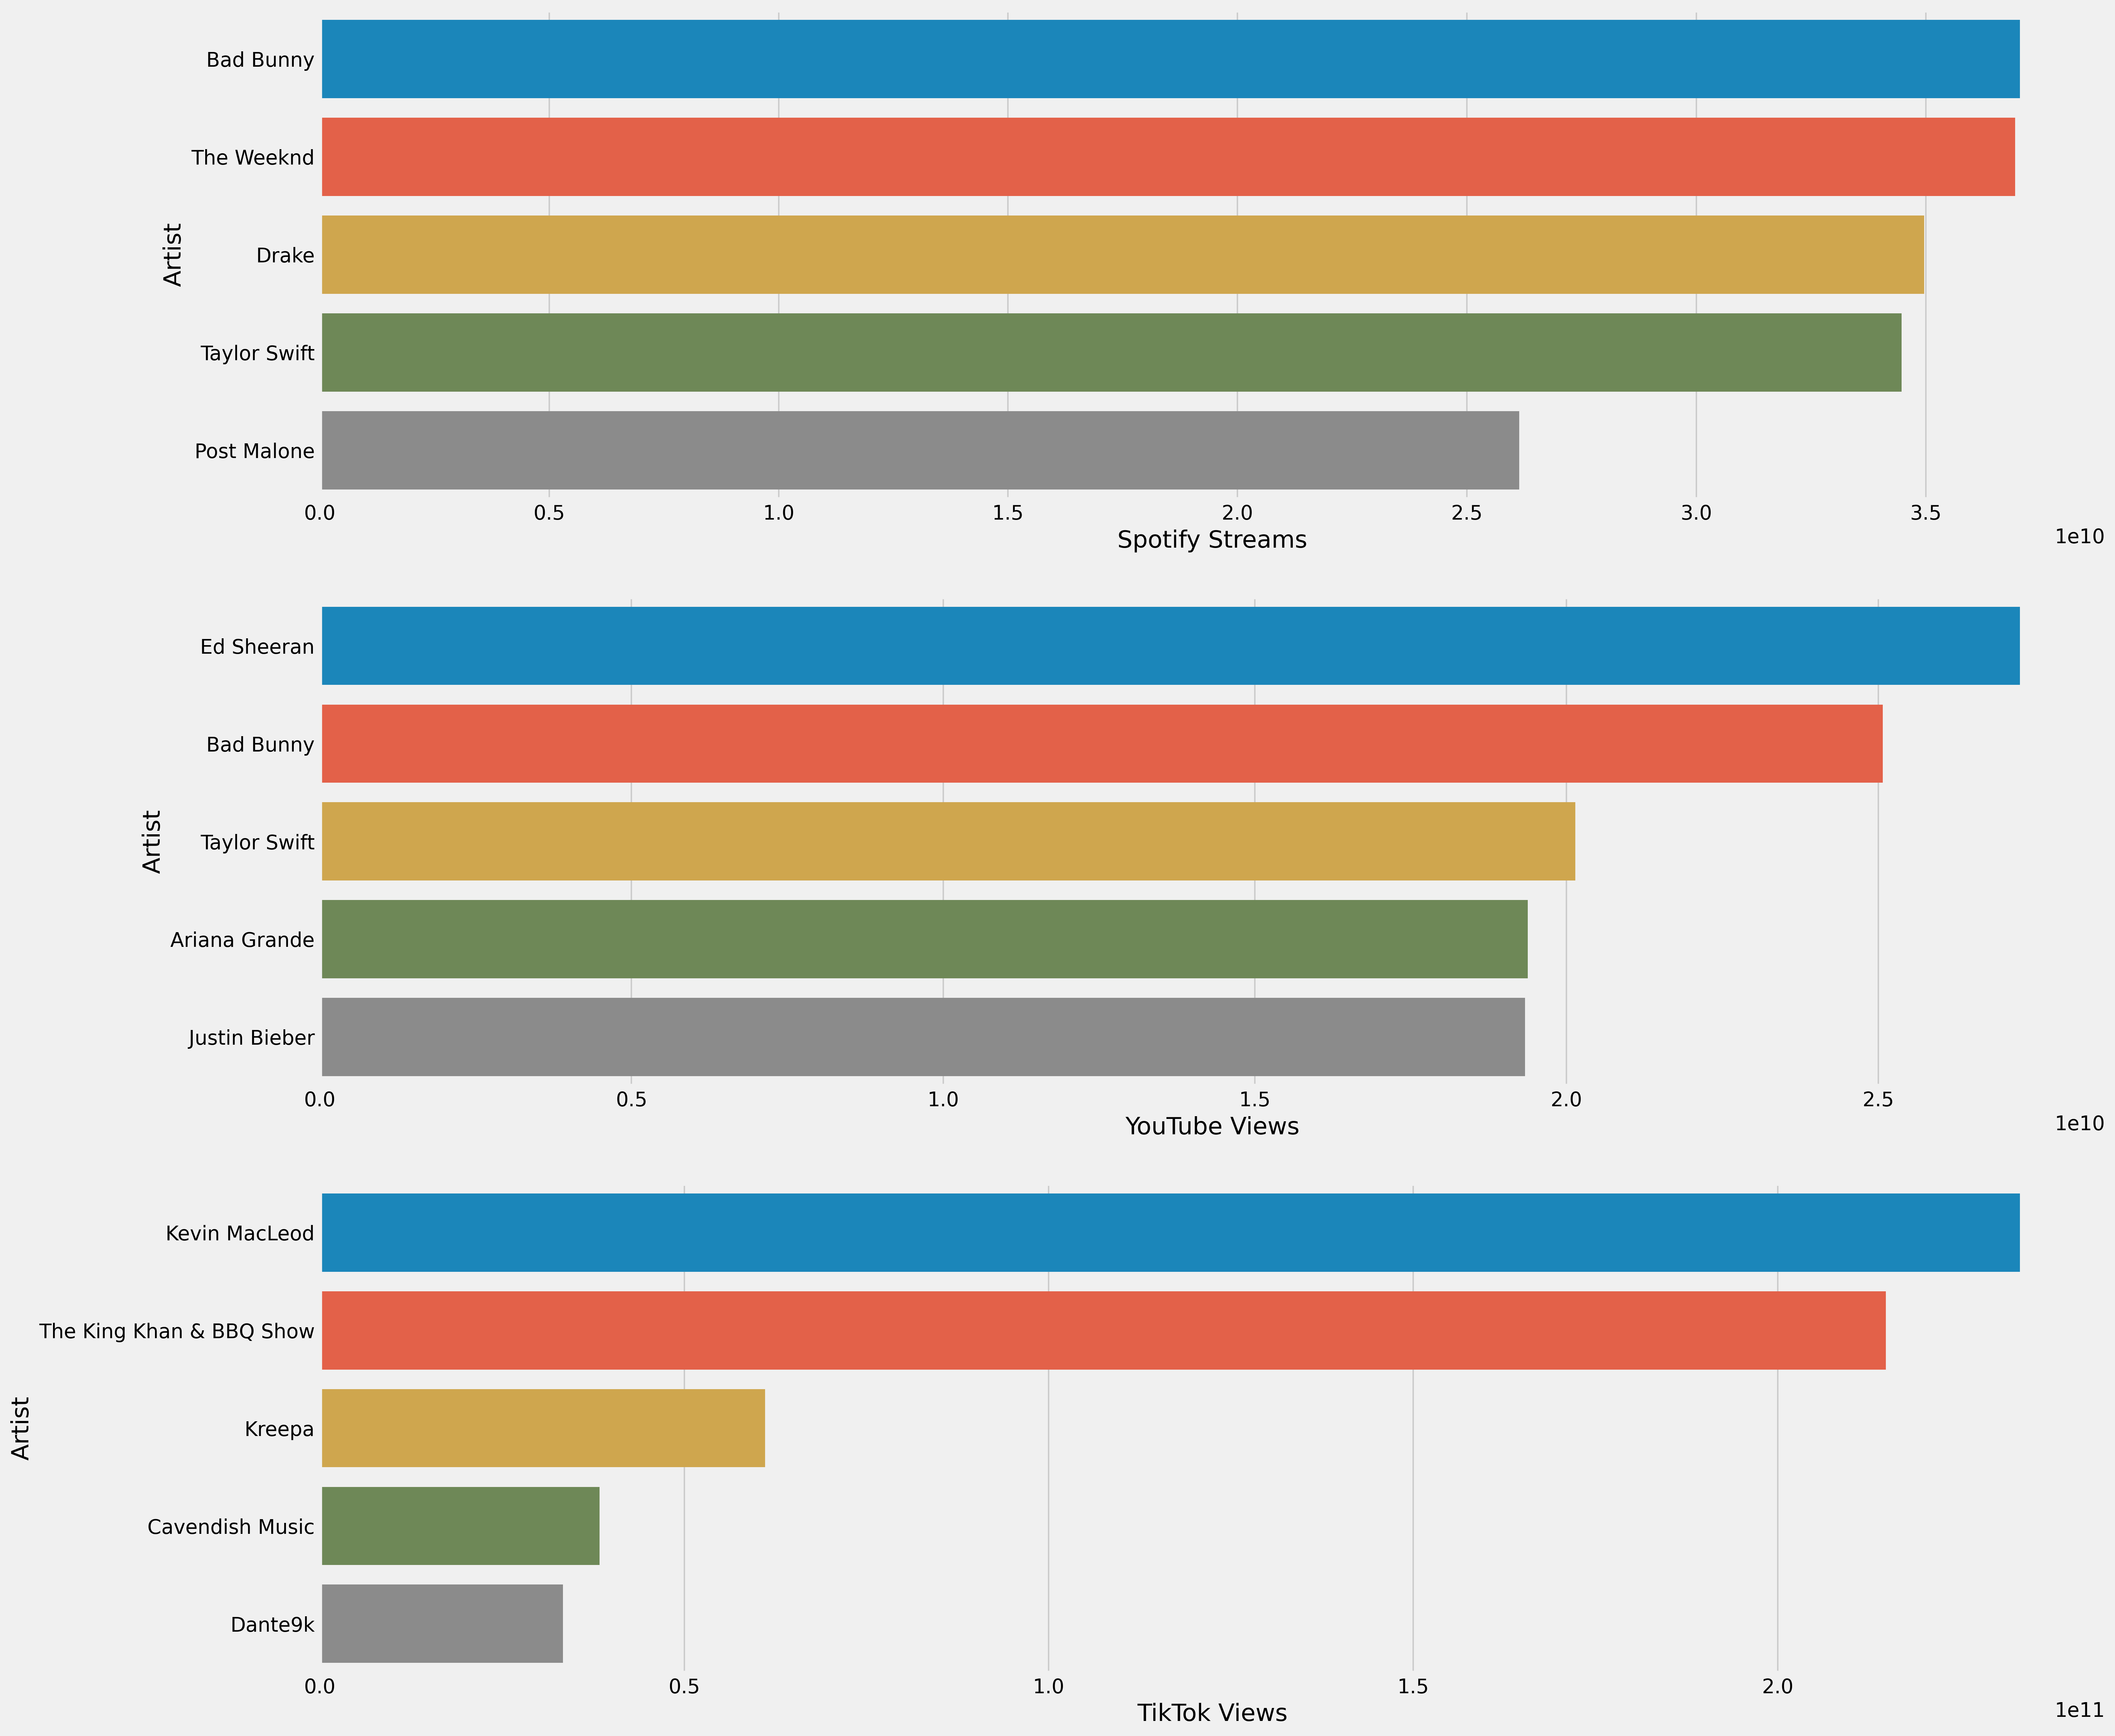
Figure 4: Most streamed artists on Spotify (upper panel), YouTube (middle panel) and TikTok (lower panel).
Figure 5 shows the top five artists for the number of released songs while Figure 6 represents their corresponding average track score. We notice that while Taylor Swift and Drake are the most prolific artists (63 songs both) their overall track scores are the lowest. This is mainly a consequence of averaging on a larger dataset (number of tracks). I have verified that using the median in place of the mean does not change the results.
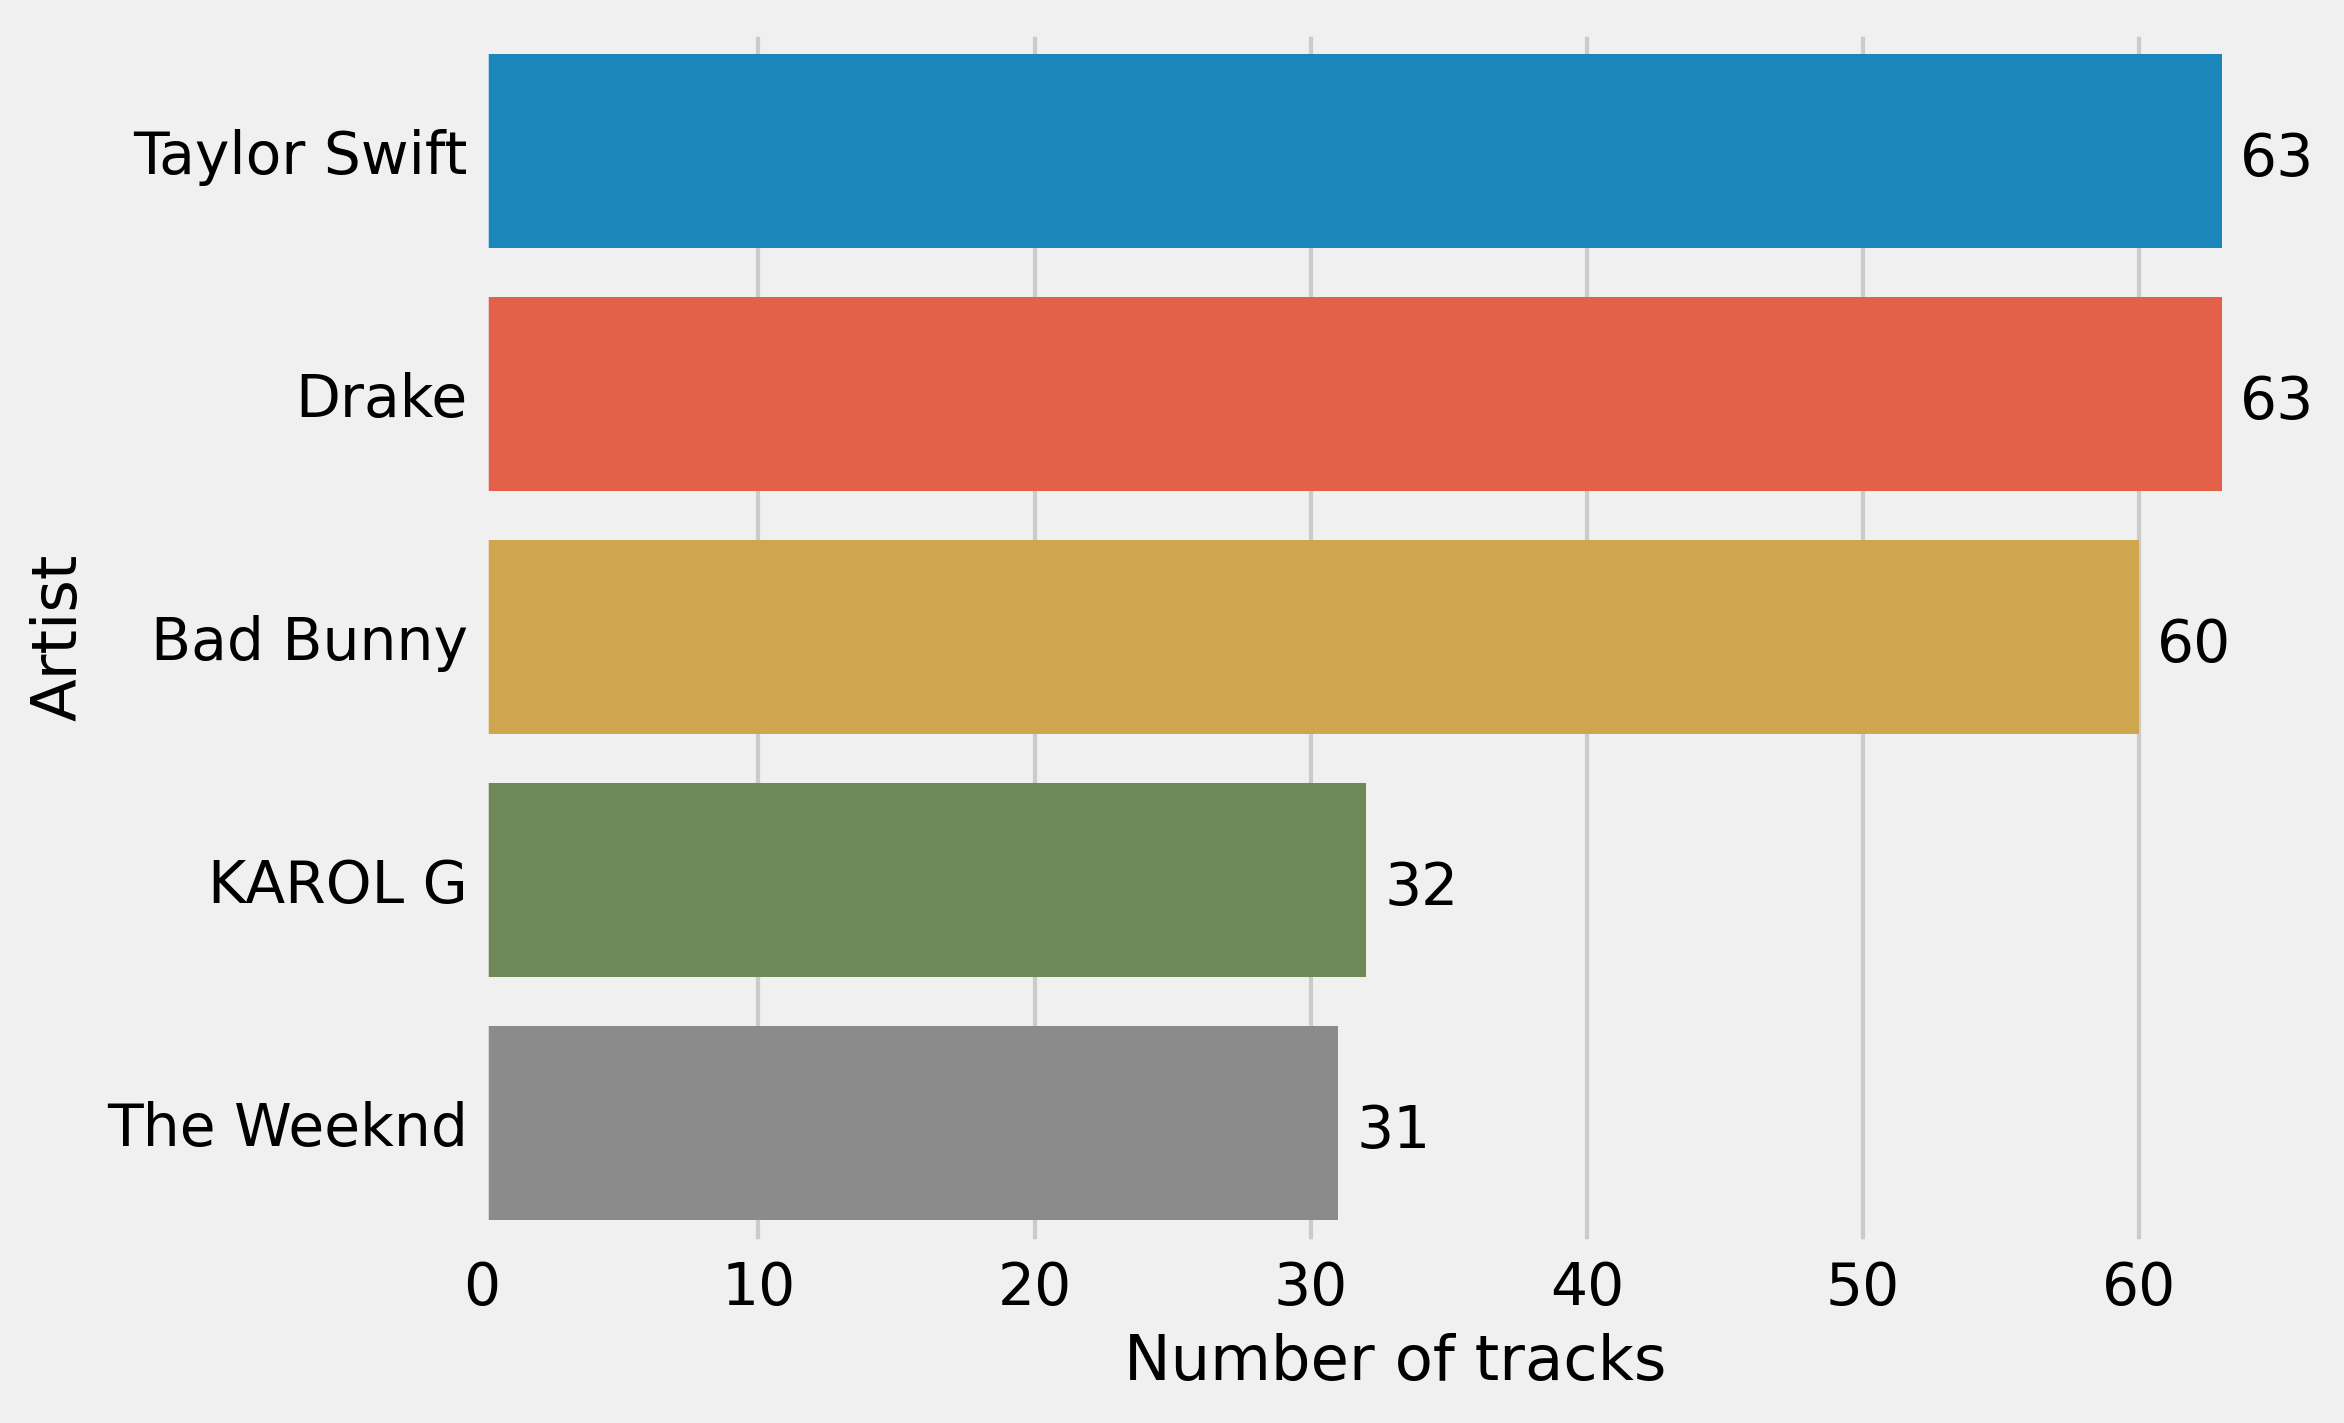
Figure 5: Top 5 artists per released songs
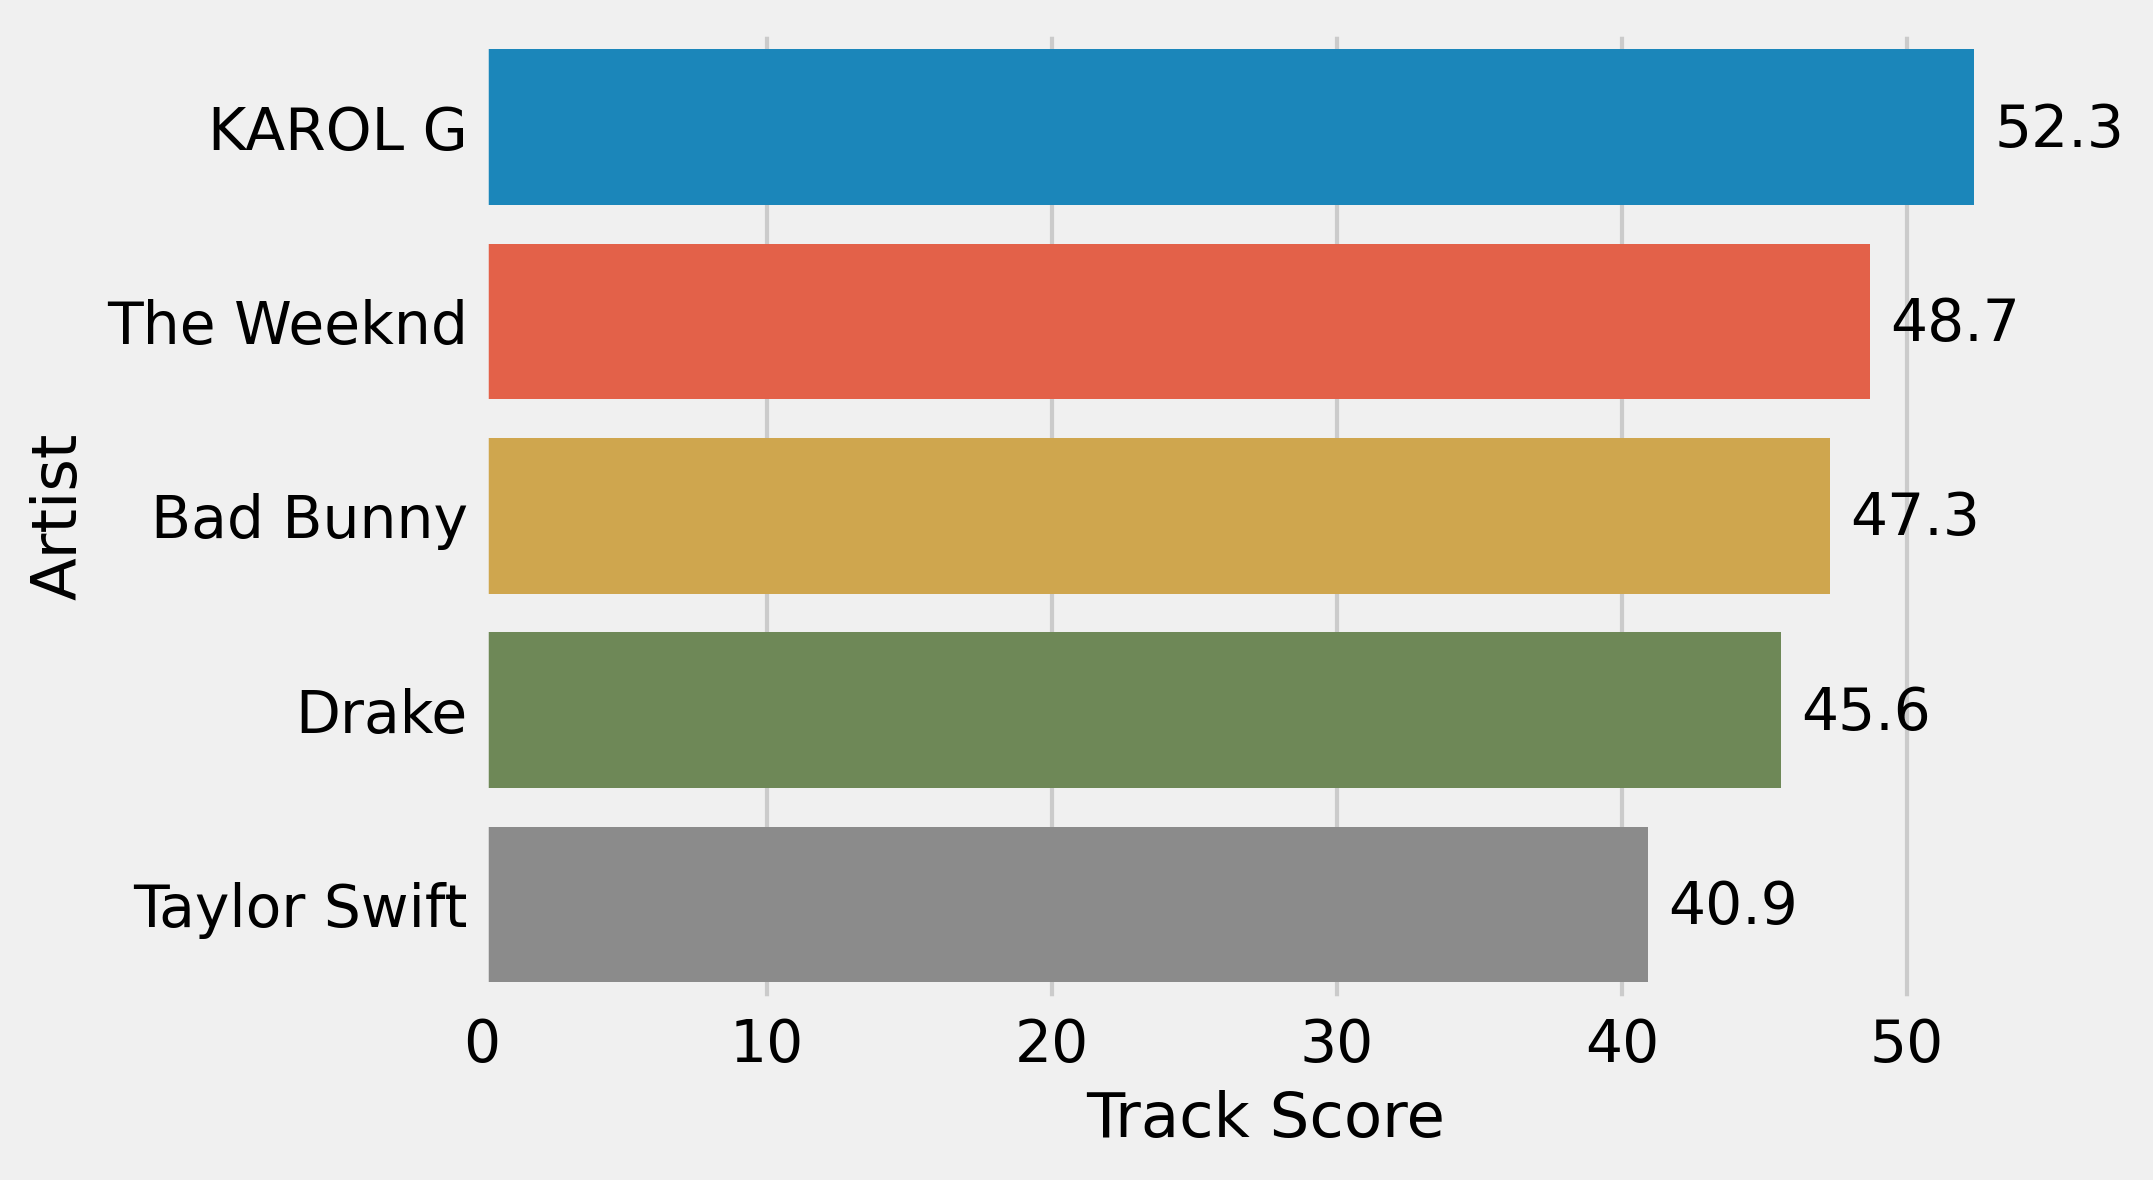
Figure 6: Mean track score corresponding to the artists in Fig. 5.
The dataset under exam also provides information whether the track contains or not curse words or language deemed sexual, violent, or offensive in general. In particular each track has been classified according to a binary classification: explicit or friendly. As shown in Figure 7, the sample is highly unbalanced towards friendly tracks (76%) against the explicit content songs (24%). However, no statistical significant difference arose between the mean track score of the two classes as depicted in Figure 8 (41.46 for friendly songs and 42.8 for explicit tracks).
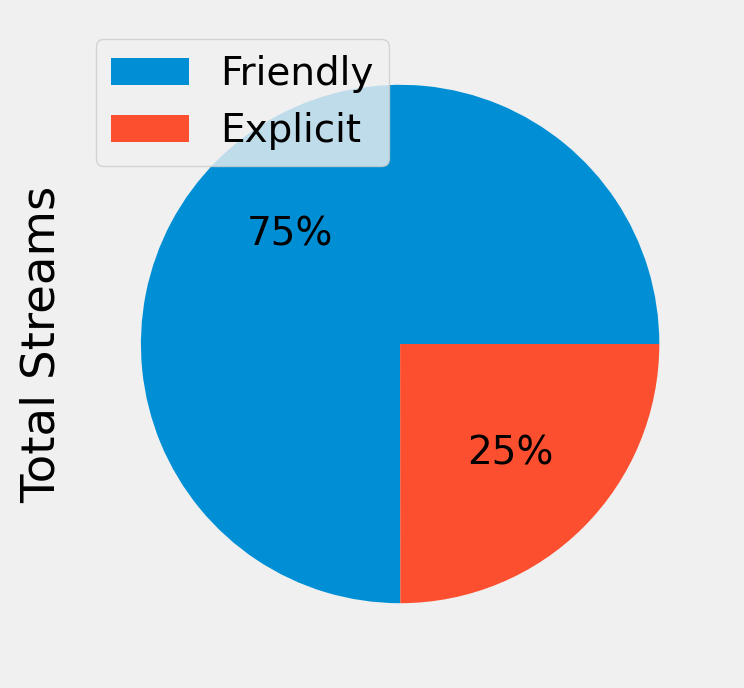
Figure 7: Shares of total streams divided by explicit or friendly classification.
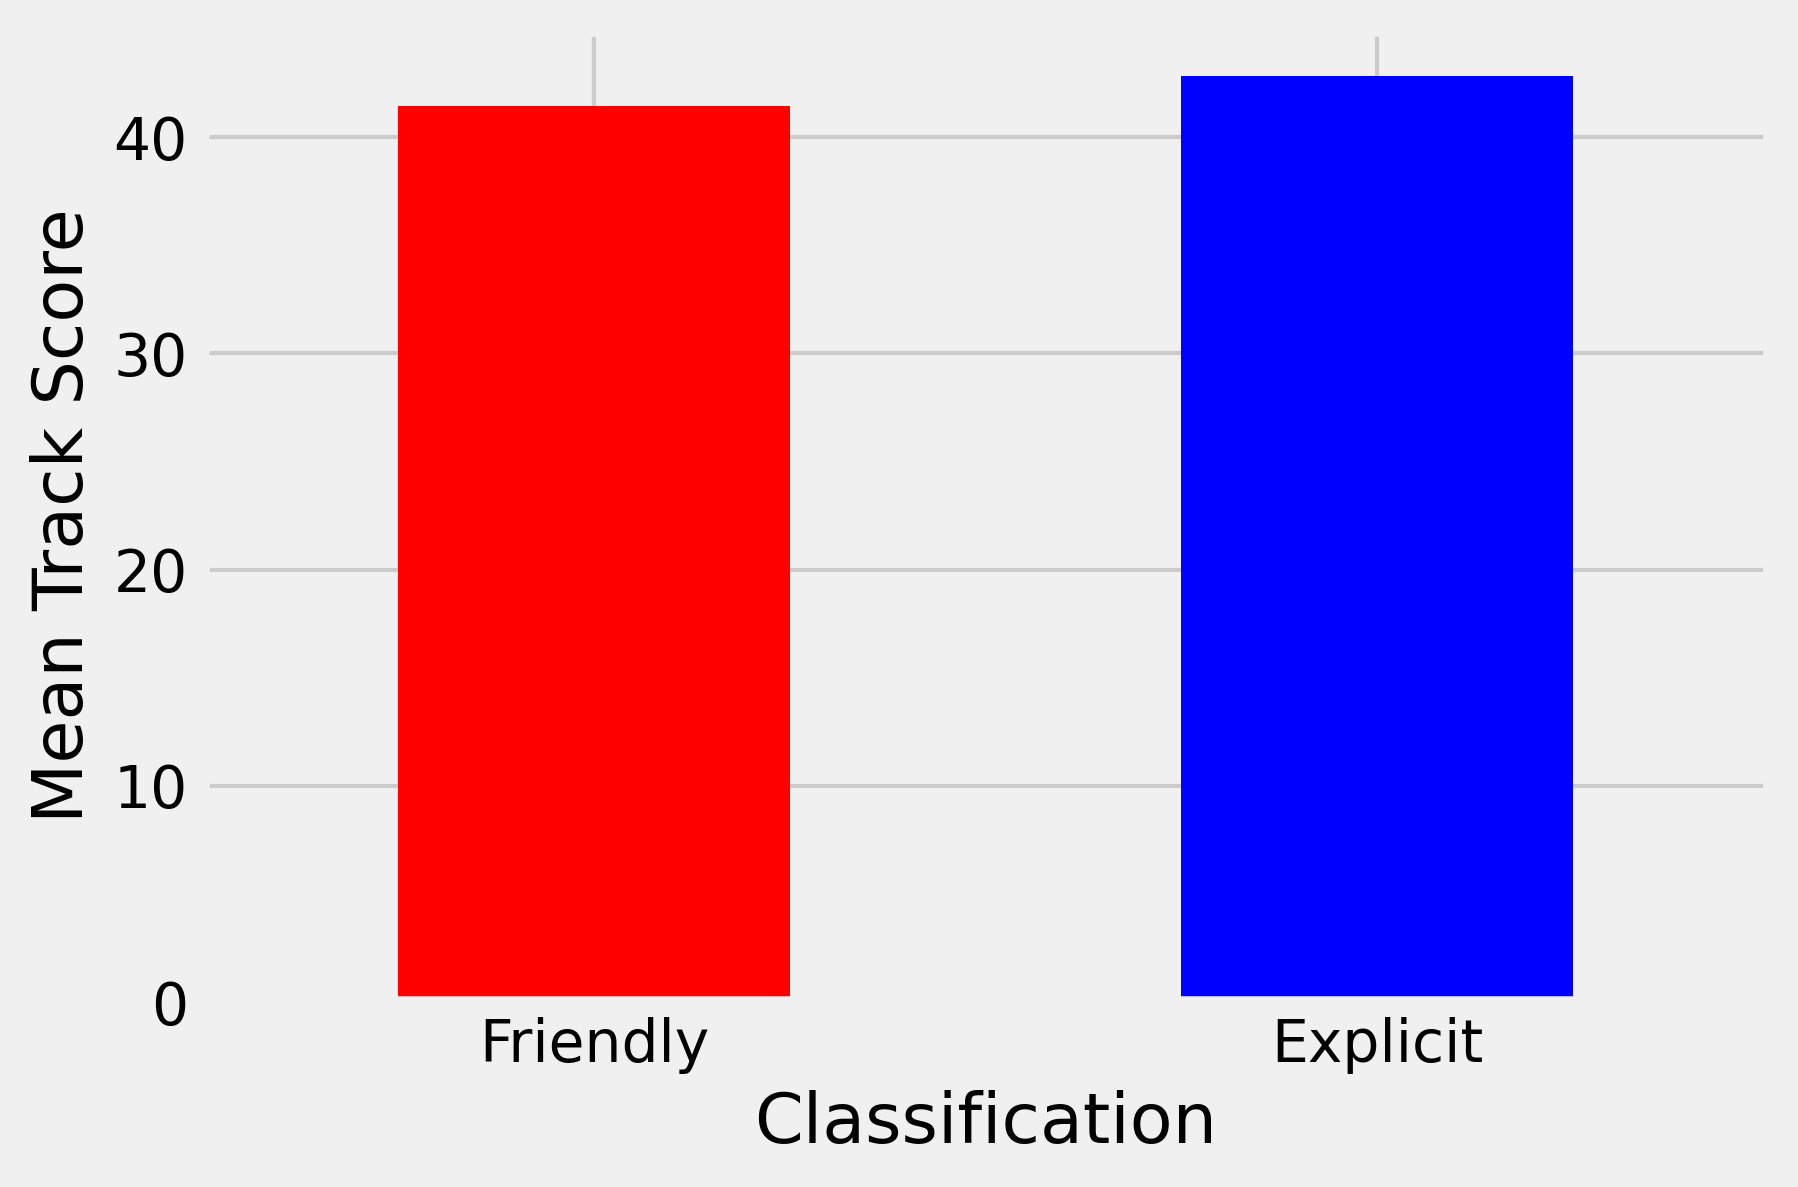
Figure 8: Track score for explicit and friendly class.
In addition, I also investigated how the number of explicit and friendly songs changed during the years. What we learn from Figure 9 is that, while friendly songs experienced an approximately constant growth from early 2000s, the same does not stand for explicit tracks. In fact, after the initial growth in the early 2000s, from 2002 to 2006 explicit songs underwent a rapid decrease. Possible factors might be attributed to the sudden decrease in explicit tracks from 2002 to 2006. For example, in the early 2000s, particularly after the 2004 Super Bowl halftime show controversy, the Federal Communications Commission in the United States increased its scrutiny and fines for indecent content on public airwaves. This led to a more cautious approach by record labels and artists regarding explicit content to avoid potential fines and censorship. Moreover, these years saw a surge in pop music’s popularity, which generally leans towards more radio-friendly and less explicit content. Artists like Britney Spears, NSYNC, and Christina Aguilera dominated the charts with music that was more commercially viable and less explicit. Eventually, after the 2001 recession and the impacts of events like 9/11, there might have been a shift towards more conservative content as the nation focused on healing and unity, influencing the type of music that was produced and promoted. From the mid-2000s onwards, hip-hop and rap genres, which often contain more explicit content, became increasingly mainstream. Artists like Kanye West, Jay-Z, and later on, artists like Drake and Kendrick Lamar, gained massive popularity, bringing explicit content back into the forefront of popular music. As societal norms evolved, there was a greater acceptance and normalization of explicit content in media, including music. This shift allowed artists more freedom to express themselves without facing the same level of backlash as in the early 2000s. The rise of digital music platforms provided artists with new distribution channels that were less regulated compared to traditional radio and TV. These platforms allowed for greater artistic freedom, including the release of explicit content without fear of censorship. Streaming services use algorithms to recommend music to users based on their listening habits, which can sometimes favor more provocative or explicit content that generates engagement and streams.
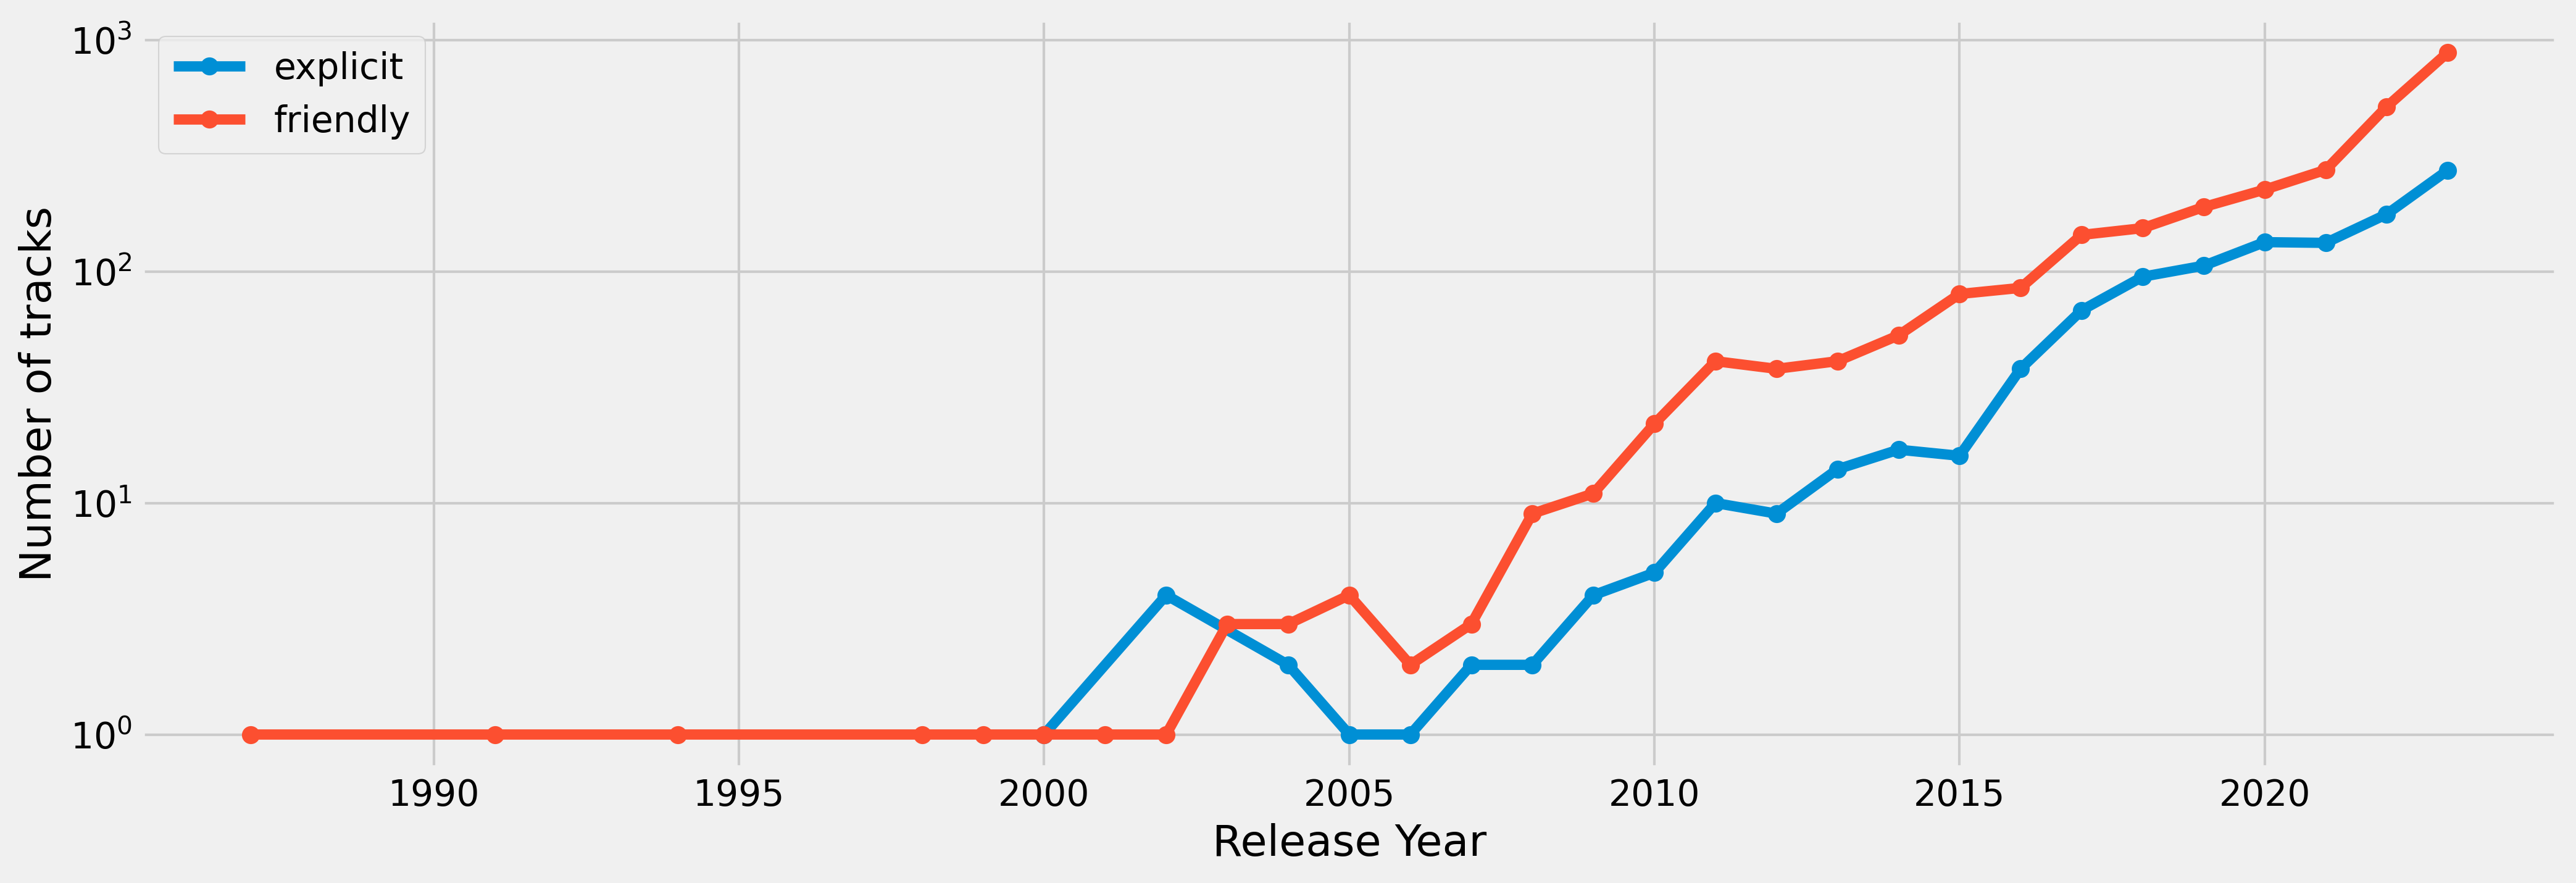
Figure 9: Number of explicit (blue) and friendly (red) tracks as a function of the year till 2023.
Eventually, I concluded this project by analyzing possible correlations between the variables available per each track by means of the correlation heatmap shown in Figure 10. This plot shows the Spearman rank between two features per each track. I chose the Spearman coefficient rather than the Pearson’s one because not all the variables were normally distributed. The Spearman coefficient is a float number comprised between -1 and +1 and expresses the monotonic relationship between the two variables (negative if -1, positive if +1 and null if 0). Of particular interest is to understand what are the most important (statistically speaking) factors that correlate with the Track Score. Looking at the first row of the correlation matrix we see that there is not a dominant feature monotonically correlated with the track score, but a weak dependence on Spotify Playlist Reach and Spotify Popularity. This is in line with what expected since the most liked songs are also those more popular. It is interesting to note the high values of the Spearman coefficient for the three sub-matrices:
- 4x4 sub-matrix formed by Spotify Streams, Spotify Playlist Count, Spotify Plalyst Reach and Spotify Popularity;
- 2x2 sub-matrix formed by YouTube Views and YouTube Likes;
- 3x3 sub-matrix formed by TikTok Posts, TikTok Likes and TikTok Views.
These three matrices stress how the algorithm behind the three platforms works: likes and views are highly correlated in a vicious cycle where the former’s growth leads the latter’s increase and viceversa.
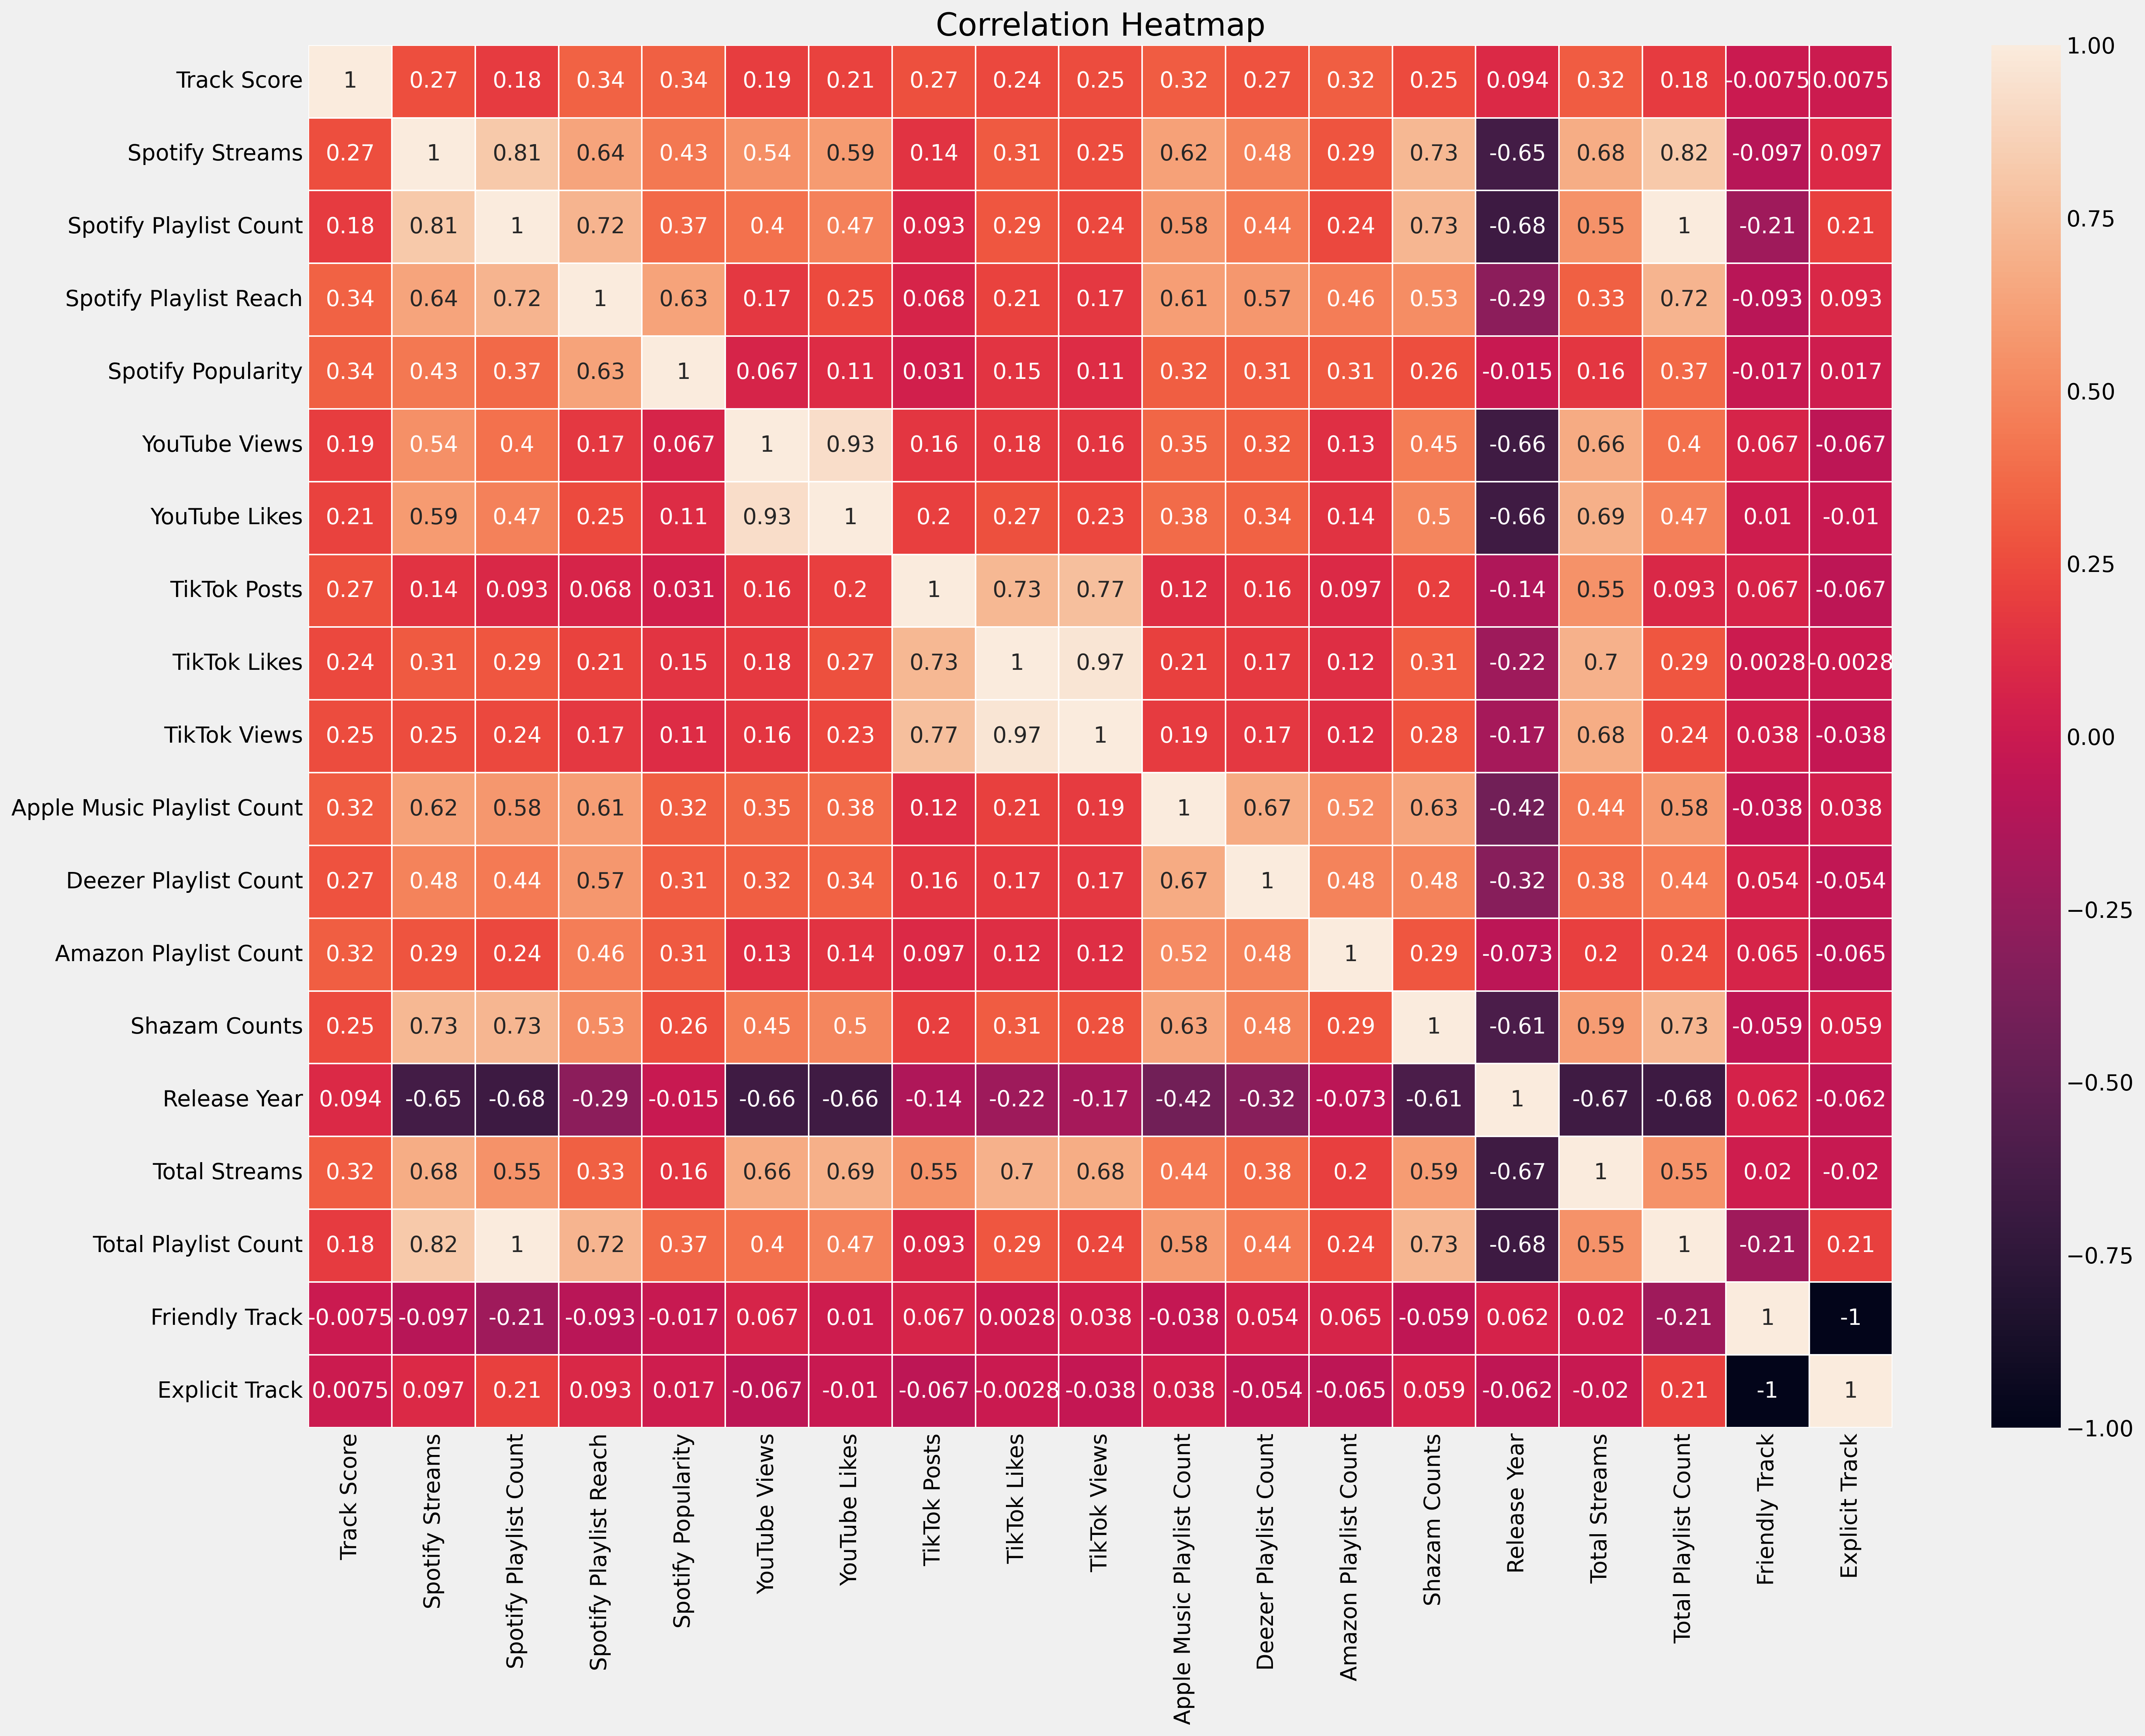
Figure 10: Pairwise correlation of data's columns.
Another important result we retrieve from Figure 10 is that the number of Spotify streams is quite strongly positive correlated with the number of Shazam counts. Thus, if people use Shazam to find the name of an unknown song then it is probably they will listen it again on Spotify. Moreover Spotify streams are negatively correlated with the release year thus suggesting the most streamed songs are also the newest one.
Recommendations and Insights
- Nowadays the music market is more accessible due to the existence of many technologies and platforms that allow users to communicate with public. This leads to an exponential growth of the number of tracks released every year;
- There is not a clear and inequivocable ideal month to release a new track. However months like January and October seem to be slightly preferred;
- The top 3 streamed songs on Spotify are: Blinding Lights, Shape of You and As It Was. The top 3 viewed songs on YouTube are: Baby Shark, Despacito and Shape of You. Thus, Shape of You is the only song that is contained in both top 3 ranks. TikTok most reproduced songs are typically soundtracks that well fit with viral videos. The top 3 listened artists on Spotify are: Bad Bunny, The Weeknd and Drake. The top 3 listened artists on YouTube are: Ed Sheeran, Bad Bunny and Taylor Swift. Finally, the top 3 listened artists on TikTok are Kevin MacLeod, The King Khan & BBQ Show and Kreepa;
- There is not a statistical significant difference in Track Score between explicit and friendly songs;
The Track Score is a complex feature that poorly correlates with all the factors taken into account. However it is slightly positive correlated with the
Spotify Playlist Reachand theSpotify Popularity.Limitations
- The dataset used in this project does not contain all the tracks on Spotify but just the most streamed ones. This means that there is a threshold value for the Spotify Streams. In fact,
df['Spotify Streams'].max()is equal to 1071. Thus we are considering all Spotify track with more than 1071 streams. - The datset contains many NaN values, even for columns of interest. We handled these values by replacing them with the median value of each column. We opted to use the median because more robust against the outliers. However, this always constitutes an approximation of the genuine dataset.
- The dataset used in this project does not contain all the tracks on Spotify but just the most streamed ones. This means that there is a threshold value for the Spotify Streams. In fact,
References
None.
This ends my Exploratory Data Analysis project of Most Streamed Spotify songs. The full Python code is available on my GitHub repository.
If you have any questions please feel free to reach me out at 📧 chrismagliano.cm@gmail.com or christian.magliano@unina.it